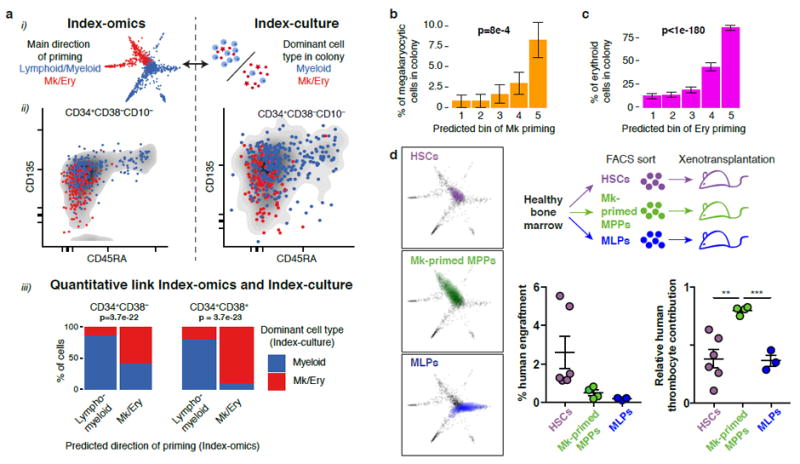
Fig. 6. The direction of transcriptomic priming is quantitatively linked to functional lineage potential.

(a) Comparison of the predominant direction of priming d (lympho/myeloid versus megakaryocyte/erythroid) obtained from single-cell transcriptomics to the dominant cell type observed in colonies from single-cell culture. (i) Illustration. (ii) Qualitative comparison of the two quantities with respect to CD45RA and CD135 surface marker expression. (iii) Quantitative link. The most likely dominant direction of priming was estimated for each founder cell from index-culture based on regression models constructed on all surface markers and compared to the observed colony composition (see Supplementary Fig. 7a). p values are from a Fisher test with n=434 cells (left panel) and n=193 cells (right panel). (b) Comparison between inferred amount of transcriptomic Mk-priming and the percentage of CD41+ Mk-cells per colony. Errors bars denote S.E.M. p-value is from a Pearson product moment correlation test with n=627 single cells that formed colonies. See also Supplementary Fig. 7c. (c) Comparison between inferred amount of transcriptomic erythroid-priming and the percentage of CD235+ erythroid cells per colony. See also Supplementary Fig. 7c. Errors bars denote S.E.M. p-value is from a Pearson product moment correlation test with n=627 single cells that formed colonies. (d) Xenotransplantation validating a Mk-primed MPP population identified by STEMNET. HSCs, MLPs, and a population of putatively Mk-primed MPPs (Lin-CD34+CD38-CD45RA-CD90-CD135-) were sorted, transplanted into immunocompromised mice and chimerism of human lymphomyeloid cells (CD45+), thrombocytes and erythrocytes was determined 2 weeks post transplantation. Experimental setup (top right panel), localization of populations in STEMNET (left panels), and human engraftment (right panels, error bars denote SEM) are indicated. Relative contribution of thrombocytes was significantly higher in MK-primed MPPs compared to HSC (p=0.0031) and MLPs (p=0.0002, two-tailed unpaired t test, n=6 HSCs, n=4 Mk-primed MPPs, n=3 MLPs)
