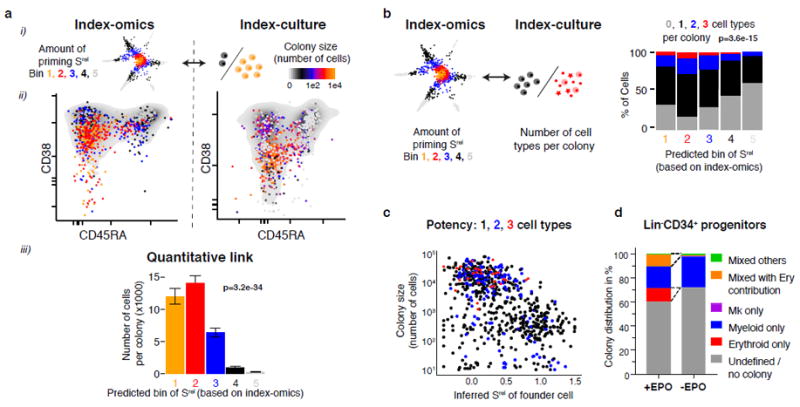
Fig. 7. The degree of transcriptomic priming is quantitatively linked to multipotency and proliferative capacity.

(a) Comparison between the inferred amount of transcriptomic priming Srel of the founder cell and the resulting colony size (cell number). (i) illustration, (ii) qualitative link and (iii) quantitative link. Errors bars denote S.E.M. p-value is from a Pearson product moment correlation test with n=1031 single cells. (b) Comparison between the inferred amount of priming Srel of the founder cell and the number of cell types in the colony. p-value is from a Pearson product moment correlation test with n=1031 single cells. (c) Inferred transcriptomic degree of priming Srel (x-axis) in relation to the colony size (y-axis) and the number of cell types per colony (colour-code). (d) Distribution of colony types in relation to the presence or absence of erythropoietin (EPO) in the culture medium.
