
Figure 6.
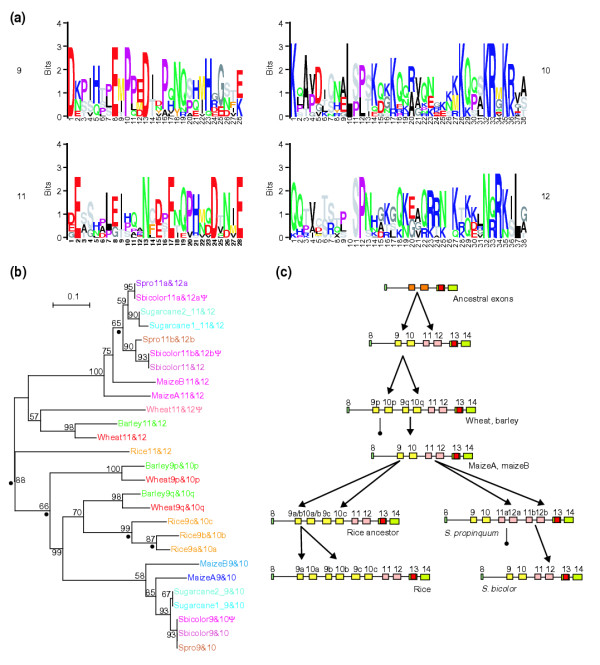
CENP-C exon repeats in the grasses. (a) Alignments of copies of the duplicated exons 9, 10, 11, and 12 from the grass species in this study, excluding pseudogenes, are shown in Logos format. (b) A neighbor-joining phylogram (with gaps excluded) of the exon pairs 9-10 and 11-12 in grass species. A parsimony tree gave essentially the same topology. Dots indicate the locations of inferred duplication events in the tree. Presumed pseudogenes are marked with ψ. (c) Schematic representation of exon duplication events leading to various Cenpc gene structures, and examples of grass species with these structures. Pairs of arrows indicate duplication events; lines terminating in a filled circle indicate loss of an exon pair in derivatives.