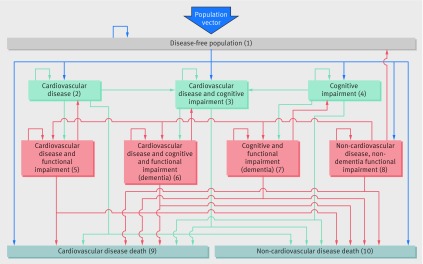
Fig 1 IMPACT-Better Ageing Model (IMPACT-BAM). Numbers represent different health states and mortality. Population vector represents the number of men and women reaching age 35 and entering the model at each calendar year. States 6 and 7 represent dementia. States 5, 6, 7, and 8 represent functional impairment or disability

An official website of the United States government
Here's how you know
Official websites use .gov
A
.gov website belongs to an official
government organization in the United States.
Secure .gov websites use HTTPS
A lock (
) or https:// means you've safely
connected to the .gov website. Share sensitive
information only on official, secure websites.
