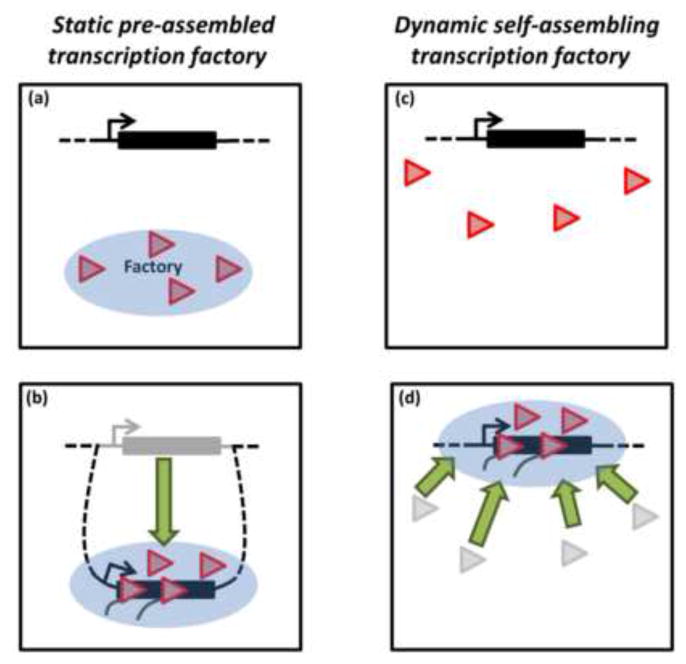
Figure 1. Models for the origin of transcription factories.

(a) Schematic cartoon of inactive gene. The blue circle indicates a static preassembled transcription factory containing Pol II and other transcription factors. For simplicity, only Pol II is shown (red triangle). (b) Upon activation, the gene moves (or loops out of its chromosome) to the preformed factory for expression. (c) Cartoon of inactive gene surrounded by nucleoplasmic pool of Pol IIs. (d) Gene activation leads to the dynamic self-assembly of Pol II transcription factory onto the gene for expression.
