
Fig. 6. Gene expression correlating with clinical parameters of coagulopathy during EVD.
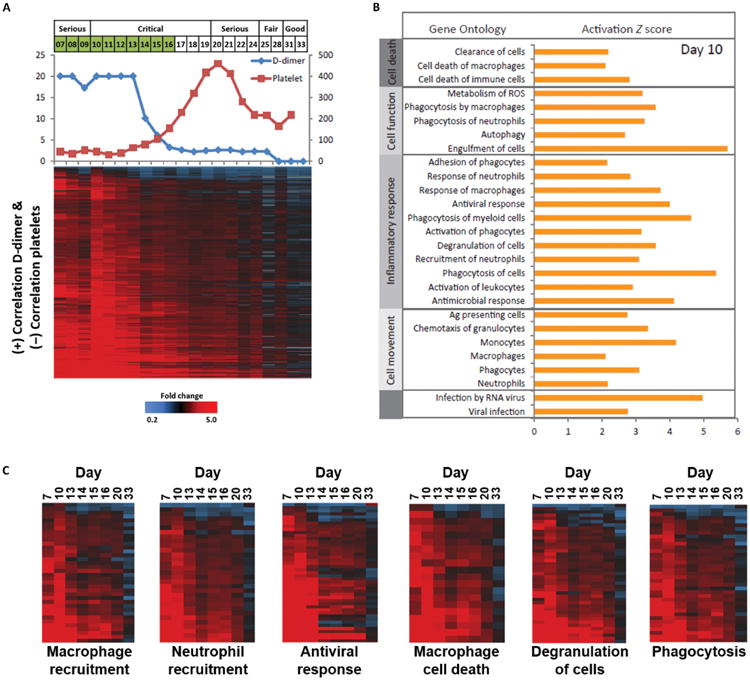
(A) Serum D-dimer (μg/ml, left axis) and platelet levels (K/μl, right axis) and heatmap showing expression profiles of transcripts (n = 1016) with expression levels that are correlated positively with serum D-dimer levels (≥.6) and negatively with platelet levels (≤-0.6). (B) Gene ontology analysis of transcripts, with expression levels correlating with serum D-dimer and platelet values (activation Z score is based on d10 expression values). (C) Expression profiles of transcripts involved in macrophage recruitment, neutrophil recruitment, antiviral response, macrophage cell death, degranulation, and phagocytosis.