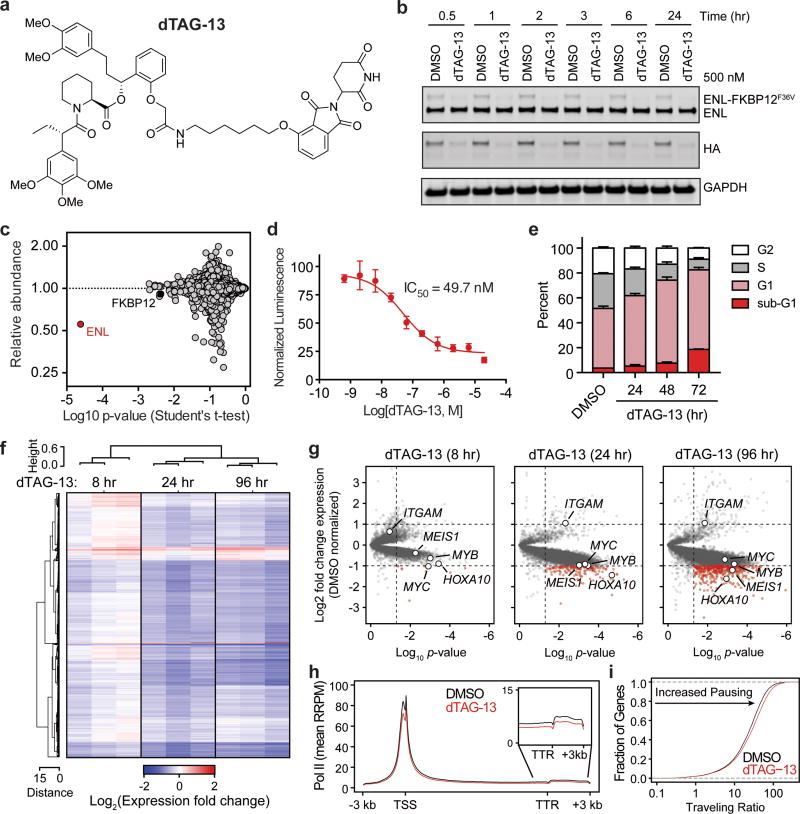
Figure 2. ENL degradation induces growth arrest and transcription defects genome-wide.
(a) Chemical structure of dTAG-13.
(b) Kinetic evaluation of ENL-FKBP12F36V degradation in MV4;11 (Cas9+, ENL-FKBP12F36V-HA+) cells.
(c) Quantification of protein abundance following a 3 hour dTAG-13 treatment (500 nM) in MV4;11 (Cas9+, ENL-FKBP12F36V-HA+, ENL−/−) cells for proteins with 3 or more quantified spectral counts, n = 3.
(d) DMSO-normalized cellular viability in MV4;11 (Cas9+, ENL-FKBP12F36V-HA+) cells after 72-hour treatment with dTAG-13 approximated by ATP-lite assay. Mean ± s.d., n = 4.
(e) Cell cycle analysis with DMSO or dTAG-13 (500 nM) treatment by BrdU incorporation. Mean ± s.d., n = 3.
(f) Heat map representation of DMSO-normalized fold changes in cell-count normalized gene expression values caused by dTAG-13 (500 nM).
(g) Volcano plot of data shown in (f). P-value derived from two-tailed Student’s t-test, n = 3.
(h) Meta gene representation of cell-count normalized ChIP-seq (ChIP-Rx) of RNA Pol II at active genes following DMSO or dTAG-13 (500 nM) treatment for 24 hours. TSS, Transcription start site; TTR, transcription termination region.
(i) Cumulative distribution plot of RNA Pol II traveling ratios from data shown in (h).

