
Extended Data Figure 4.
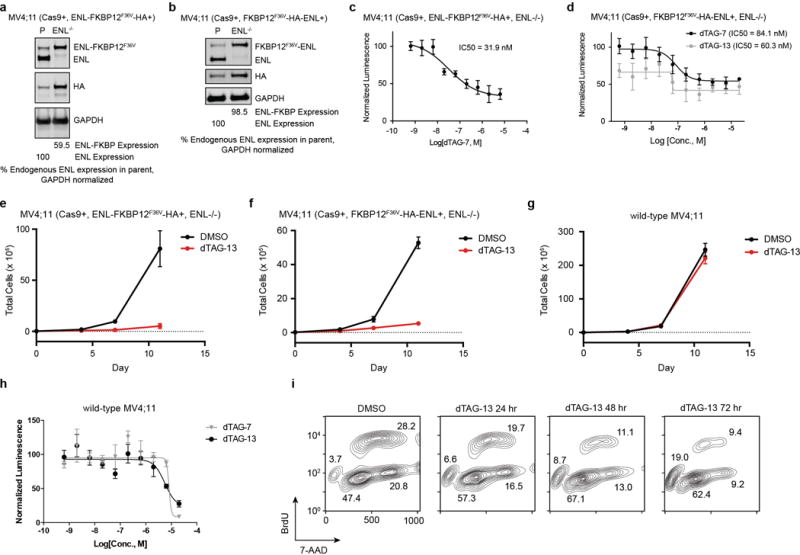
(a) CRISPR-Cas9 knockout of endogenous ENL in MV4;11 (Cas9+, ENL-FKBP12F36V-HA+) cells. ENL/HA immunoblot in MV4;11 (Cas9+, ENL-FKBP12F36V-HA+) (P, parental) and MV4;11 (Cas9+, ENL-FKBP12F36V-HA+, ENL−/−) cells.
(b) CRISPR-Cas9 knockout of endogenous ENL in MV4;11 (Cas9+, FKBP12F36V-HA-ENL+) cells.
(c) DMSO-normalized cellular viability of MV4;11 (Cas9+, ENL-FKBP12F36V-HA+, ENL−/−) cells after 72-hour treatment with dTAG-13 approximated by ATP-lite assay (means ± s.d., n = 4).
(d) DMSO-normalized cellular viability of MV4;11 (Cas9+, FKBP12F36V-HA-ENL+, ENL−/−) cells after 72-hour treatment with dTAG-7 or dTAG-13 approximated by ATP-lite assay (means ± s.d., n = 4).
(e) Growth over time of MV4;11 (Cas9+, ENL-FKBP12F36V-HA+, ENL−/−) cells treated with DMSO or dTAG-13 (500 nM). Total number of viable cells as approximated by trypan blue exclusion is plotted over time (means ± s.d., n = 3).
(f–g) As in (e), but with cell line indicated at top.
(h) As in (d), but with wild-type MV4;11 cells.
(i) Representative plots of BrdU incorporation used for cell cycle analysis shown in Fig. 2f.