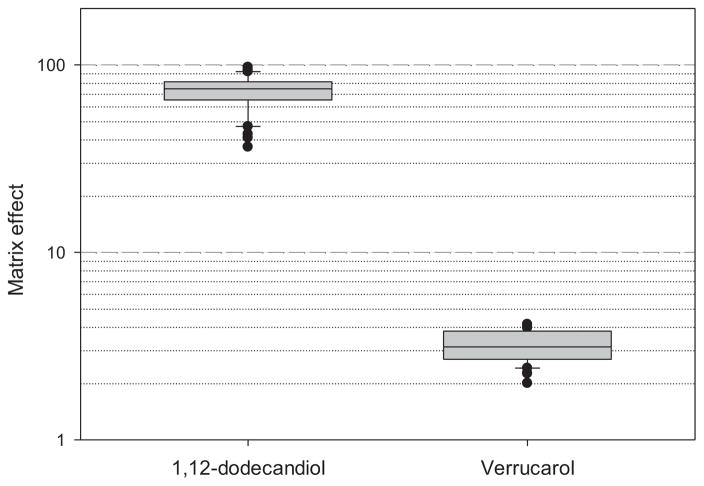
Figure 2.
Matrix effect calculated by peak area for standard spiked into dust extract divided by that spiked into neat solvent. Data for the box plots are from 4 different concentrations for verrucarol and one fixed concentration for 1,12-dodecanediol (internal standard) in each standard curve of the five experiments. Dust extract was prepared with one sample with no detectable amount of ergosterol, and culturable Stachybotrys and Myrothecium species. Box=25–75 percentile; solid line in the box=median; whiskers=5 and 95 percentiles; and filled circles = outliers.

