
Fig. 3.
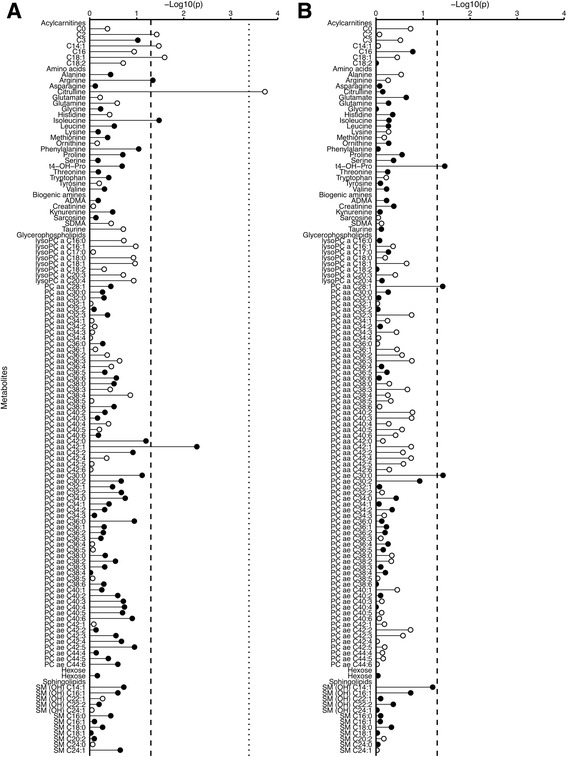
Statistical significance of associations between metabolite concentrations and prostate cancer risk by time to diagnosis. a Five years or less between blood collection and diagnosis; n = 428 matched case-control sets. b More than 5 years between blood collection and diagnosis; n = 649 matched sets. Statistical significance was plotted as –log10(p values). The dashed and the dotted lines represent conventionally statistical significance and statistical significance after controlling the false discovery rate (Benjamini-Hochberg), respectively, both at α = 0.05. Filled circles represent positive associations, and unfilled circles represent inverse associations. The p values were derived from a conditional logistic regression using log metabolite concentration as a continuous variable and adjusting for exact age (continuously), body mass index (fourths; unknown), smoking (never; past; current; unknown), alcohol intake (<10; 10–19; 20–39; ≥40 g of alcohol per day; unknown), education (primary or none; secondary; degree level; unknown) and marital status (married or cohabiting; not married or cohabiting; unknown)