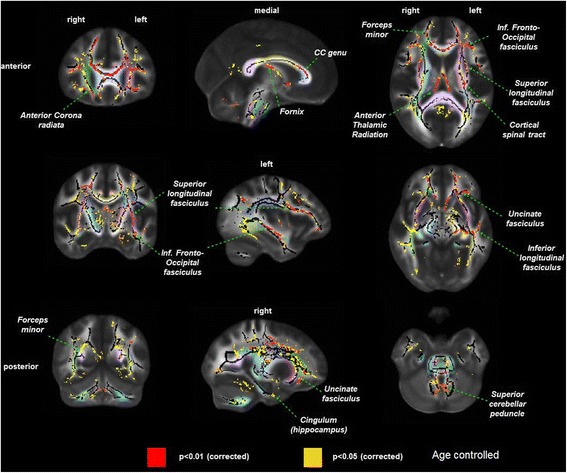
Fig. 1.

Difference in white matter damage assessed by fractional anisotropy in prevalent hemodialysis patients (n = 34) versus controls without kidney disease (n = 26), controlled for age. p values are corrected to account for multiple testing. Left column = coronal view, middle column = sagittal view, right column = axial view. Red = areas with most significant differences in FA (p < 0.01), yellow = remaining areas with differences in FA (p < 0.05). Pastel colors indicate distinct white matter fibers/bundles, which are labeled within the figure
