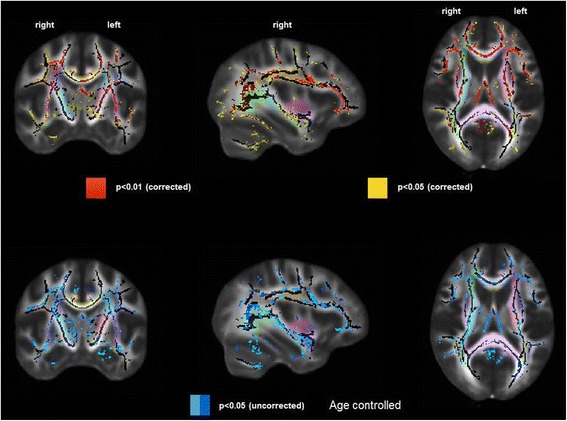
Fig. 3.

Difference in white matter damage assessed by fractional anisotropy in prevalent hemodialysis patients, separated by number of cardiovascular risk factors (zero or one vs more than one) compared to controls without kidney disease. Top row = Hemodialysis group with more than one vascular disease risk factor (n = 17) vs controls without kidney disease (n = 17). Bottom row = Hemodialysis group with zero or one vascular disease risk factor (n = 17) vs controls without kidney disease (n = 17). Left column = coronal view, middle column = sagittal view, right column = axial view. Red = areas with the most significant differences in FA, yellow = remaining areas with significant differences in FA. Pastel colors indicate distinct white matter fibers/bundles
