
Fig. 3.
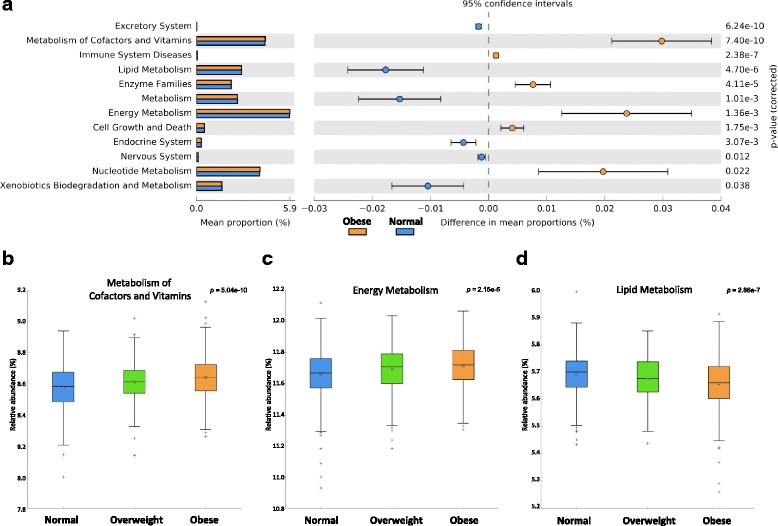
Comparison of PICRUSt predicted KEGG function data based on BMI categories. a An extended error bar plot for the comparison of normal vs obese groups. Only functions with P < 0.05 are shown. b–d Box plots for multiple group analysis of normal/overweight/obese groups. b ‘Metabolism of Cofactors and Vitamins’ (P value, 5.04 × 10⁻¹³), c ‘Energy Metabolism’ (2.15 × 10⁻⁵), d ‘Lipid Metabolism’ (2.86 × 10⁻⁷). P value was calculated by Bonferroni multiple test correction methods