
Fig. 2.
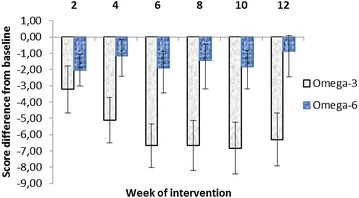
Pairwise comparison of fatty acid effects as the difference between CDI score (±SE) at the baseline and the week of investigation. n (Omega-3 group) = 17, n (Omega-6 group) = 18
Official websites use .gov
A
.gov website belongs to an official
government organization in the United States.
Secure .gov websites use HTTPS
A lock (
) or https:// means you've safely
connected to the .gov website. Share sensitive
information only on official, secure websites.
Pairwise comparison of fatty acid effects as the difference between CDI score (±SE) at the baseline and the week of investigation. n (Omega-3 group) = 17, n (Omega-6 group) = 18