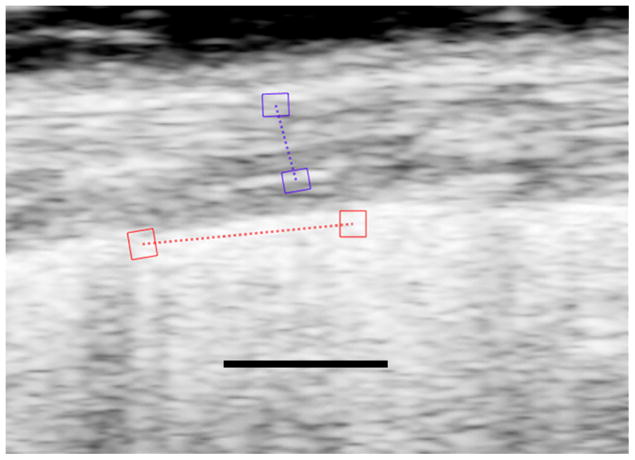
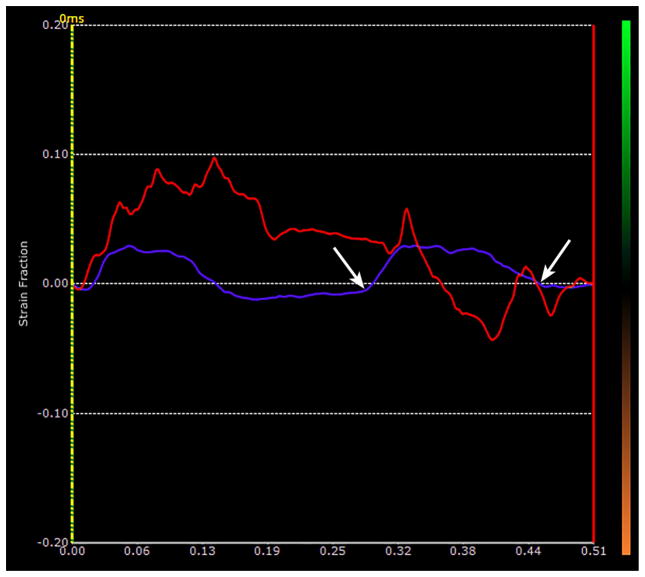
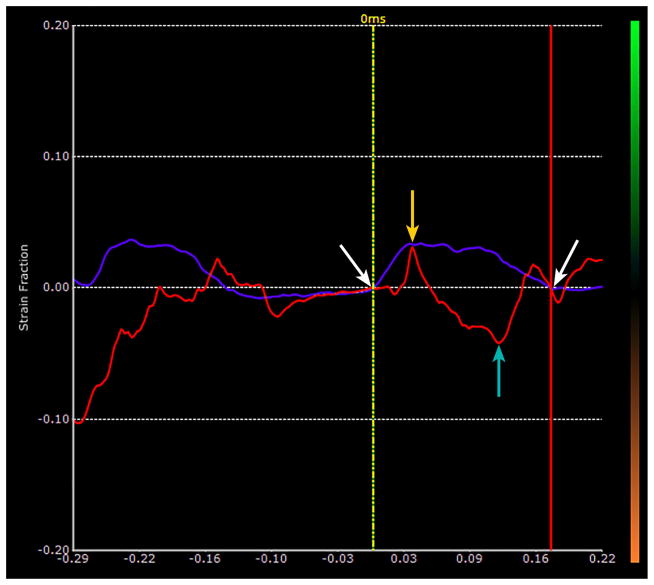
Figure 2.
Fig 2a. Image of the lung of bleomycin treated mouse with pulmonary fibrosis. As in Fig. 1, the red ROIs lie on the lung surface and the purple ROIs lie in the hypoechoic superficial soft tissues. The strains are measured along the dotted lines between the respective ROIs. The black line represents 1 mm and is located in what would be lung parenchyma if the sound were able to penetrate into the lung.
Fig 2b. Plot of time dependent strain of the lung surface in the bleomycin treated mouse shown in Fig. 2a. The red plot represents the strain along the lung surface and the purple represents the strain in the superficial soft tissue. The white arrows represent the limits of the second breath in this sequence. Notice that the lung surface strain has largely drifted off the base line, and the breaths are very hard to identify from the lung surface strain plot.
Fig. 2c. Same plot as that shown in Fig 2b that has been strain drift corrected for the second breath. The two vertical lines are drawn to intersect the beginning and end of the second breath as defined by the soft tissue strain. The limits are the same as shown in Fig 2b and are marked with white arrows. Points of intersection with the vertical lines are translated down to the baseline, i.e. zero strain, as marked by the white arrows. The strain in the breath is now defined as the difference between the peak strain, orange arrow, minus the minimum strain, turquoise arrow which corresponds to about 7.0%.


