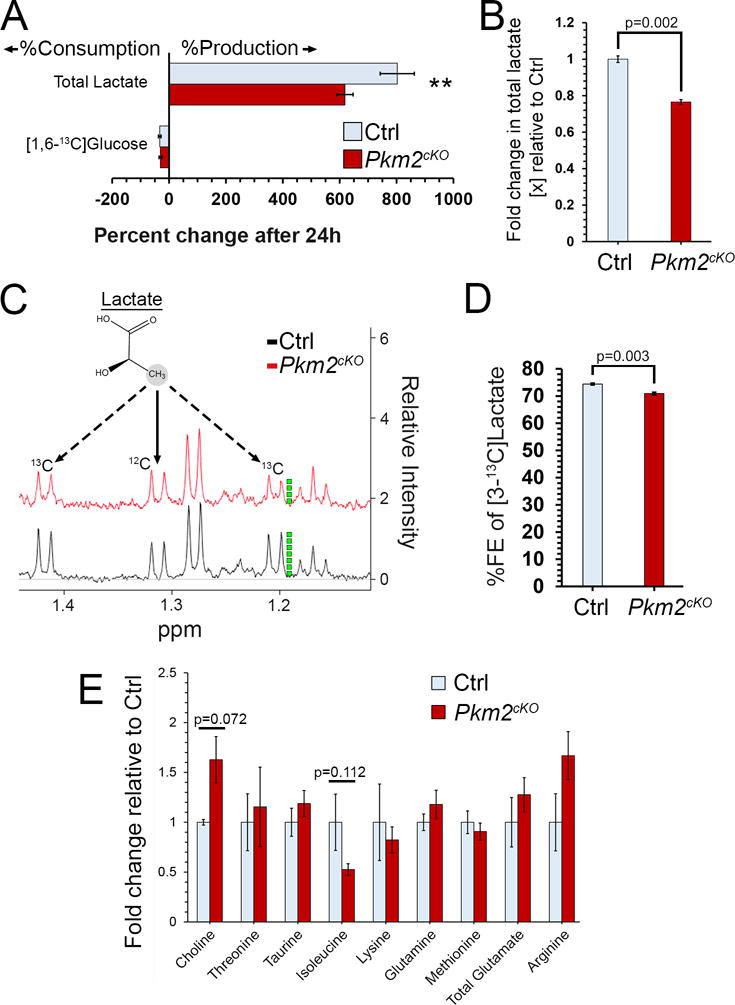
Figure 5. Pkm2 deletion reduces lactate production.

(A) 1H NMR analysis of media sampled after 24h of culture demonstrates decreased lactate in Pkm2cKO wells (n=4) compared to controls (n=3) (**p=0.029). (B) Comparison of media lactate between genotypes, measured by enzymatic assay. (C) Representative 1H NMR spectra of Ctrl and Pkm2cKO 24h media demonstrate the peaks representing [3-13C] lactate (dashed line) and unlabeled lactate (solid line). (D) Quantification of 13C-enriched fraction of lactate, from samples in (A). (E) LC-MS analysis of indicated metabolites in CGNP extracts, comparing genotypes. Graphs present mean±s.e.m. P-values determined by Student’s t-tests. FE=fractional enrichment.
