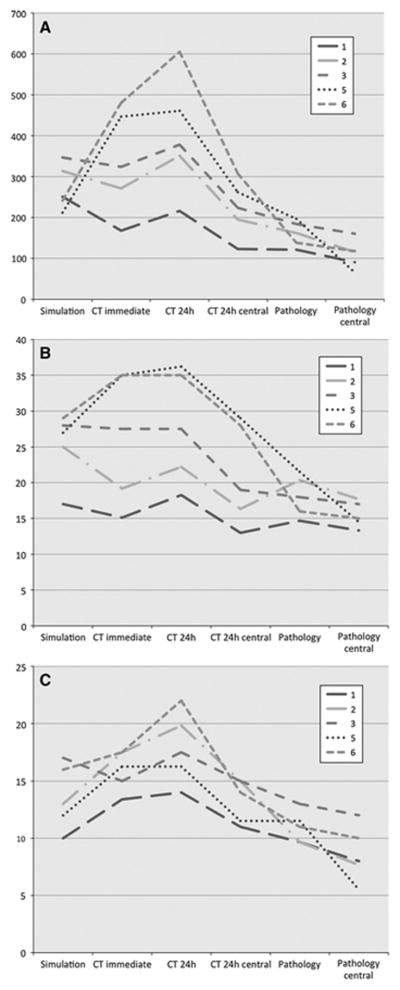
Figure 3.
Comparison of simulated, CT and histopathology measured ablation zones. CT 24h central shows the non-enhancing central zone of ablation. Pathology central shows the central zone of complete ablation. The remaining measurements include central and peripheral zones. Cross-sectional areas [mm2] (A) were calculated from axial long (B) and short axis (C) measurements [mm].

