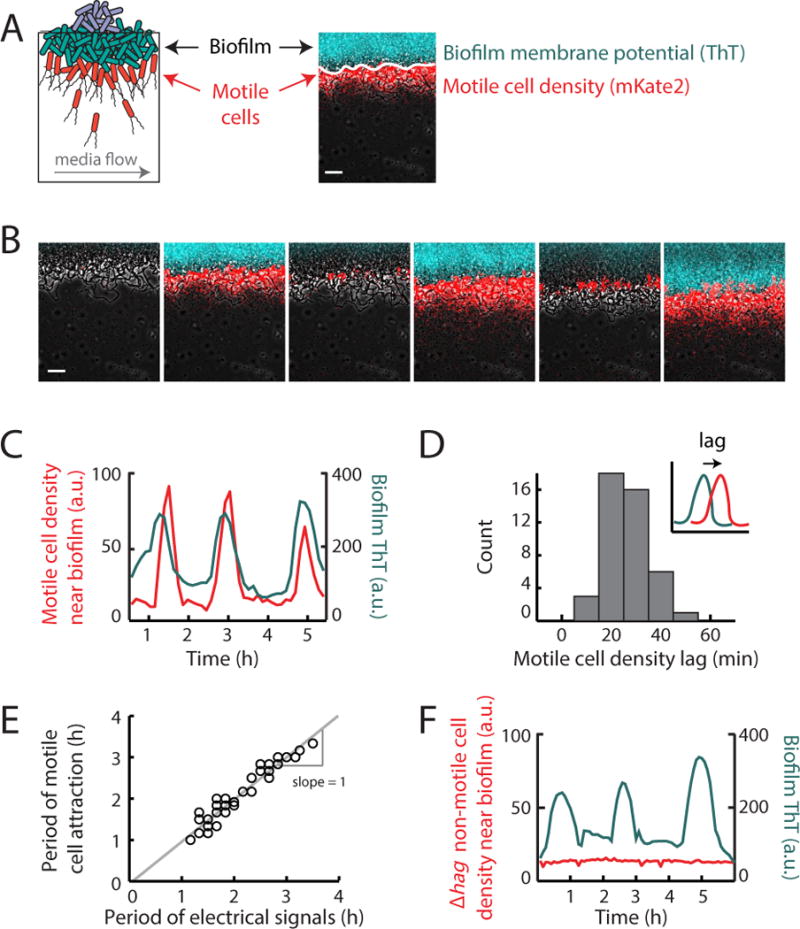
Figure 1.

Distant motile cells are periodically attracted to an electrically oscillating biofilm. (a) Illustration of motile cell interaction with a biofilm within a shared microfluidic growth chamber (see Figure S1). Media flows in the direction indicated by the gray arrow, at a rate of 12 μm/s. Membrane potential changes are reported by Thioflavin T (ThT, pseudocolored cyan), a cationic dye that acts as a Nernstian voltage indicator (Prindle et al. 2015). ThT fluorescence increases when the cell becomes more inside-negative, making ThT fluorescence inversely related to the membrane potential. Motile cells (pseudocolored red) express a fluorescent protein mKate2 from the Phyperspank promoter induced with 1 mM IPTG. Motile cell density is measured using mKate2 fluorescence (only present in motile cells) in the 100 μm region outward from the biofilm edge (indicated as a solid white line, see Quantification and Statistical Analysis). Scale bar, 50 μm. (b) Filmstrip showing the edge of a biofilm which is located on the top of each image. Images depict periodic motile cell attraction to an electrically oscillating biofilm and subsequent passive dispersal away from the biofilm. Gray (phase contrast), cyan (membrane potential), red (motile cells). Scale bar, 50 μm. (c) Time series of motile cell density (red) near the biofilm edge together with membrane potential reporter ThT measured within the biofilm (cyan). Time series shows that motile cell density changes periodically along with electrical oscillations within the biofilm. Time series is representative of 3 independently reproduced experiments. (d) Histogram of the time between peaks in biofilm electrical activity and peaks in motile cell attraction (motile cell density lag). Motile cell peaks occur on average 26.4 ± 8.8 min after the initiation of electrical oscillations within the biofilm (mean ± st. dev., n = 44 pulses, see Quantification and Statistical Analysis). Inset, illustration of the quantification method for motile cell density lag. Motile cell density lag is defined as the time between the electrical pulse (cyan) and the motile cell pulse (red), represented with an arrow (See Quantification and Statistical Analysis). (e) Scatter plot of the periods of electrical oscillations within biofilms (peak to peak) and the periods of co-occurring pulses in motile cell attraction (peak to peak). Periods of motile cell attraction correlate with natural variations in the periods of electrical oscillations within biofilms (see Quantification and Statistical Analysis, Pearson correlation coefficient = 0.96, n = 33 periods). (f) Time series of non-motile (Δhag, red) cell density together with biofilm membrane potential (cyan). Time series shows no periodic attraction of non-motile cells to an oscillating biofilm. Time series is representative of 3 independently reproduced experiments. See also Figure S2.
