Figure 7.

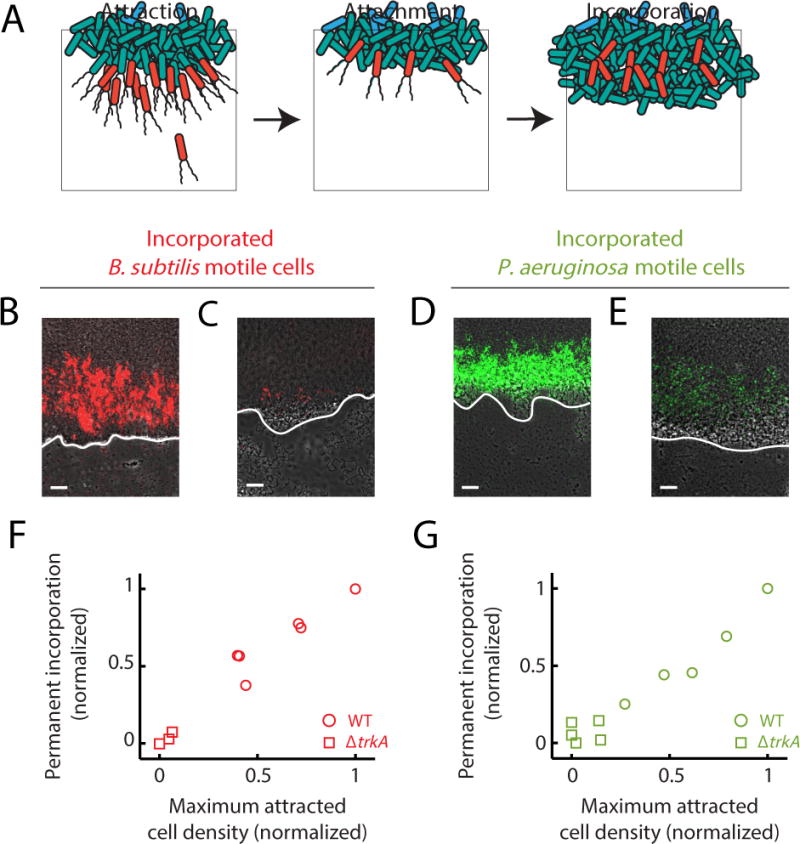
Attraction can lead to incorporation of motile cells into biofilms, depending on the strength of the attraction. (a) Illustration of how attraction can lead to incorporation of new cells into a pre-existing biofilm. Attracted cells (left panel) can remain attached to the biofilm following attraction (middle panel). Subsequent growth of the biofilm leads to capture of attached cells, resulting in permanent incorporation (right panel). (b) Image of previously attracted B. subtilis motile cells (red) that have been incorporated into a pre-existing wild type B. subtilis biofilm. Image representative of 6 independently reproduced experiments. Incorporated cells are surrounded by cells originating from the pre-existing biofilm and are located inside the biofilm. (c) Image of previously attracted B. subtilis motile cells that have been incorporated into a pre-existing ΔtrkA biofilm. Reduced B. subtilis motile cell attraction to ΔtrkA biofilms that are deficient in electrical signaling results in diminished incorporation into the biofilm. Image representative of 6 independently reproduced experiments. (d) Image of previously attracted P. aeruginosa motile cells that also became incorporated into a pre-existing B. subtilis biofilm. Image representative of 12 independently reproduced experiments. (e) Image of previously attracted P. aeruginosa motile cells that have become incorporated into a pre-existing B. subtilis ΔtrkA biofilm. Diminished incorporation of P. aeruginosa motile cells is also observed as a consequence of reduced attraction to ΔtrkA B. subtilis biofilms. Image representative of 5 independently reproduced experiments. (b, c, d, e) White lines indicate each biofilm edge, and biofilms are located at the top of each image. Gray (phase contrast), red (B. subtilis motile cells), green (P. aeruginosa motile cells). Scale bars, 50 μm. (f, g) Scatter plots comparing the average peak motile cell density during attraction to biofilms and the resulting permanent incorporation of these attracted cells into biofilms (See Quantification and Statistical Analysis). The observed direct relationship indicates that the incorporation of attracted motile cells depends on the degree of attraction. (f) Circles, B. subtilis motile cell attraction and incorporation into wild type B. subtilis biofilms (n = 6 independently reproduced experiments); squares, B. subtilis motile cells attraction and incorporation into electrical signaling deficient ΔtrkA B. subtilis biofilms (Pearson correlation coefficient = 0.98, n = 3 independently reproduced experiments). (g) Circles, P. aeruginosa motile cell attraction and incorporation into wild type B. subtilis biofilms (n = 6 independently reproduced experiments); squares, P. aeruginosa motile cell attraction and incorporation into signaling deficient ΔtrkA B. subtilis biofilms (Pearson correlation coefficient = 0.91, n = 5 independently reproduced experiments).
