
Figure 2.
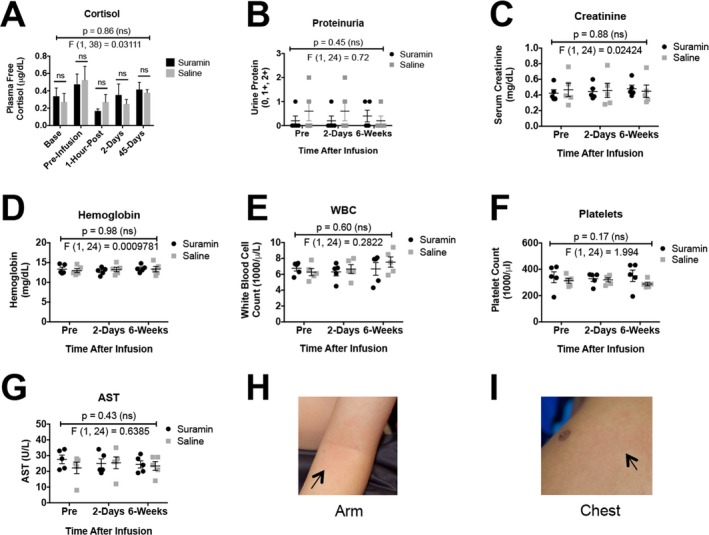
Safety monitoring. (A) Free cortisol, (B) proteinuria, (C) creatinine, (D) hemoglobin, (E) white blood cells (WBC), (F) platelets, (G) aspartate aminotransferase (AST), (H) rash – antecubital fossa, (I) chest. Data were analyzed by two‐way ANOVA to test for treatment, time, and treatment × time interaction effects. P and F values reflect the treatment effect. Only the rash was significantly different between suramin and placebo groups.