
Figure 2.
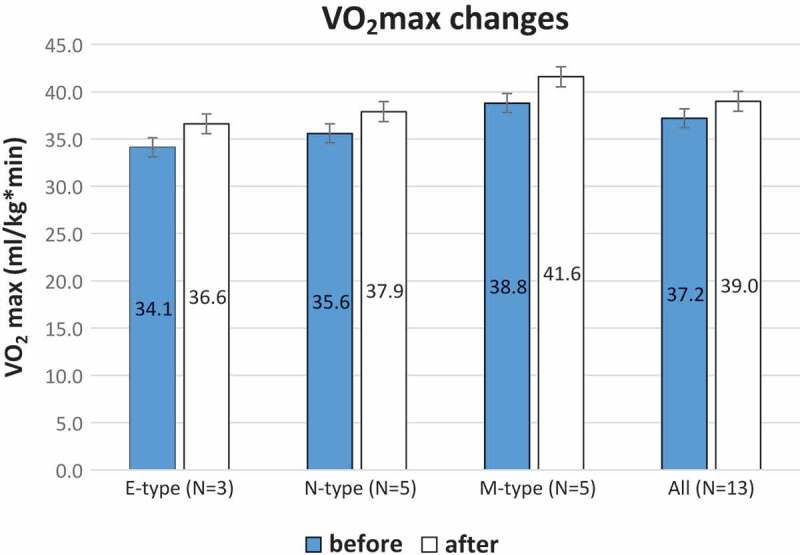
Mean values with standard errors of VO2max in ml/kg per minute before (blue histograms) and after (white histograms) the period of training for E-types (n=3), N-types (n=5) and M-types (n=5), and all participants with valid VO2max results (n=13).