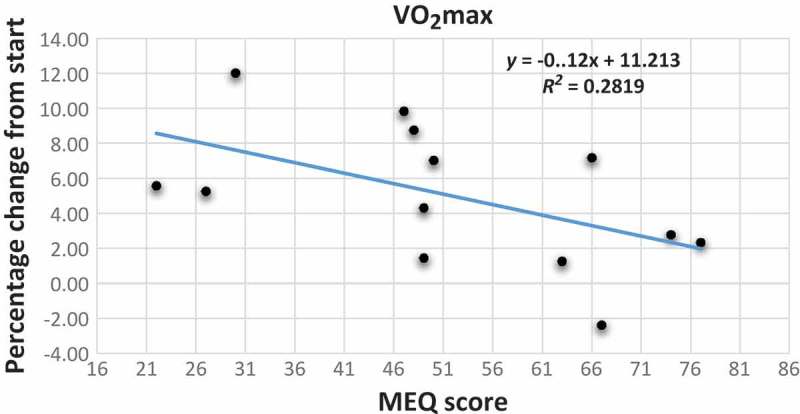
Figure 3.

Scatter plot with trend line showing the relationship between the percentage change from start of VO2max as the dependent variable and the MEQ scores of the participants. MEQ score scale: E-type 16–41; N-type 42–58; M-type 59–86.

Scatter plot with trend line showing the relationship between the percentage change from start of VO2max as the dependent variable and the MEQ scores of the participants. MEQ score scale: E-type 16–41; N-type 42–58; M-type 59–86.