
Figure 7.
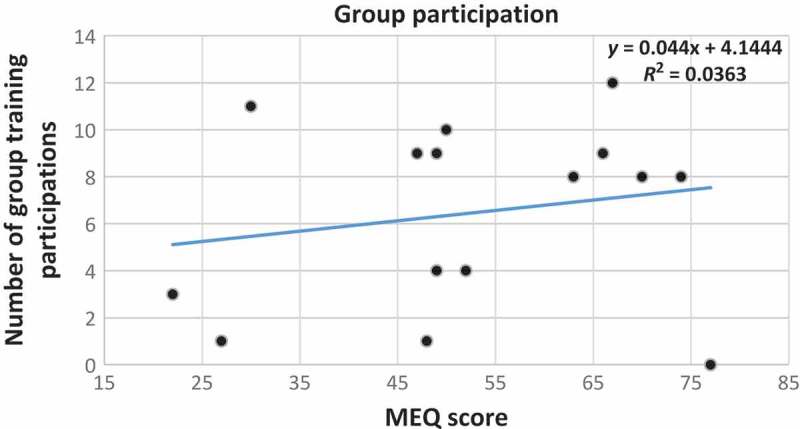
Scatter plot with trend line showing the relationship between the number of participants attending group training as the dependent variable and the MEQ scores of all of the participants.
Official websites use .gov
A
.gov website belongs to an official
government organization in the United States.
Secure .gov websites use HTTPS
A lock (
) or https:// means you've safely
connected to the .gov website. Share sensitive
information only on official, secure websites.
Scatter plot with trend line showing the relationship between the number of participants attending group training as the dependent variable and the MEQ scores of all of the participants.