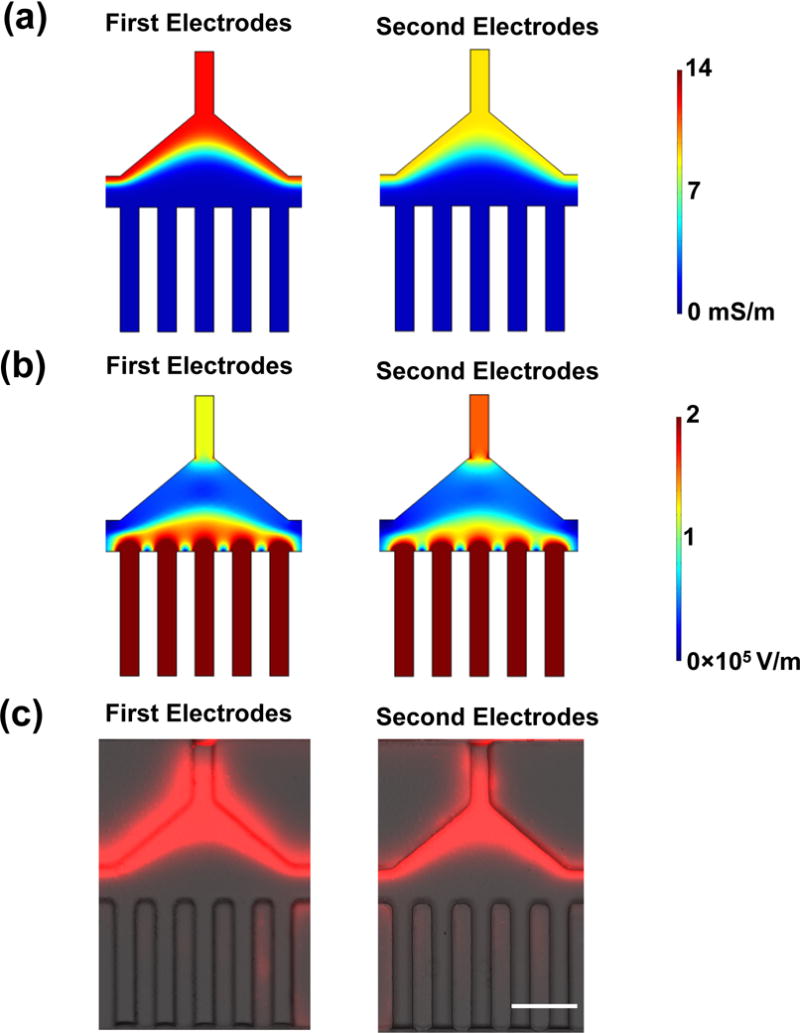
Figure 2.

Analysis of conductivity and electric field distribution. (a) The simulated conductivity distribution in the first and second electrode regions. The conductivity of the modified DEP buffer is 14 mS/m, and the conductivity of the original DEP buffer is 1 mS/m. (b) The simulated electric field in the first and second electrode regions. The modified DEP buffer is introduced into I1 and the original DEP buffer is introduced into I2, when 88 V is applied on the device. (c) The distribution of Rhodamine B at the first and second electrodes regions without electric field. Scale bar: 100 μm. The velocity at the beginning of the main channel was set as 6 mm/s. The flow rate of the modified DEP buffer with Rhodamine B (10 μg/mL): 50 μL/hr, the flow rate of the original DEP buffer: 250 μL/hr.
