
Figure 2. Silencing of Notch blocks PL and lymphangiogenic sprout formation.
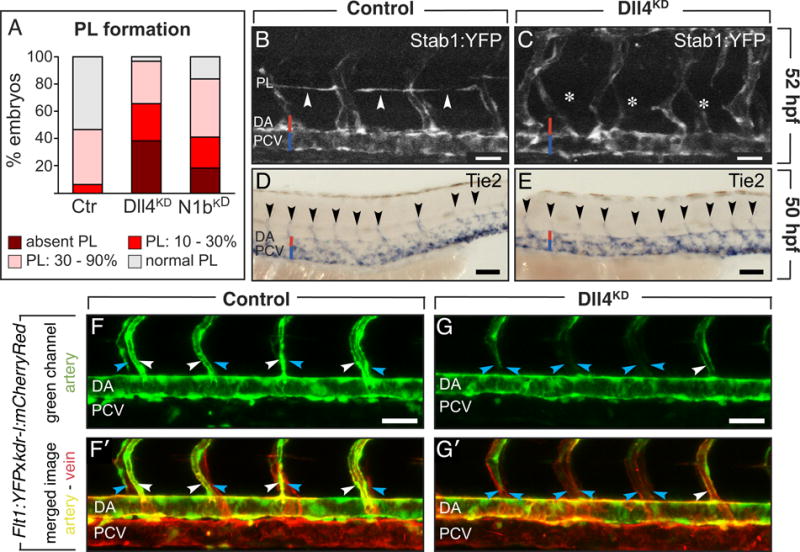
A, Percentage of 52-hpf embryos with affected PL in control (N=73), Dll4KD embryos (N=55; 10ng Dll4SPL; P<0.001) or Notch-1bKD (N1bKD) embryos (N=49; 20ng Notch-1bATG; P<0.001). B,C, Confocal images of 52-hpf Stab1:YFP embryos, showing normal PL in controls (arrowheads; B), but absence in Dll4KD embryos (asterisks; C). D,E, Whole-mount in situ Tie2 staining at 50 hpf, revealing normal numbers of secondary sprouts (arrowheads) in control (D) and Dll4KD (E) embryos. F,G, Confocal images of vessels in Flt1:YFPxkdr-l:mCherryRed embryos: kdr-l:mCherryRed marks venous and arterial vessels red (red channel not shown), Flt1:YFP labels arterial vessels green (F,G), and merged images show arterial vessels yellow and venous vessels red (F′,G′). Lateral views with left and right side ISVs partially superimposed. Imaging was at 54 hpf, when secondary angiogenic sprouts had already connected to primary ISVs, which were changing arterial to venous identity in a ventral-to-dorsal pattern. In controls (F,F′), half of the aISVs became connected by angiogenic sprouts from the PCV and acquired a venous identity, thereby losing their green arterial signal (blue arrows; F) and becoming red only (blue arrows; F′), while the other half of the ISVs remained connected to the DA and were green (white arrows; F) or yellow in the merged image (white arrows; F′). By contrast, in the Dll4KD embryo (G,G′), most ISVs lost their green arterial marker (blue arrows; G; note the single white arrow), and became marked in red only (blue arrows in G′). White arrow in G,G′ denotes a residual aISV retaining its green (G) or yellow (G′) label. Bars: 50μm (B,C,F,G); 100μm (D,E).