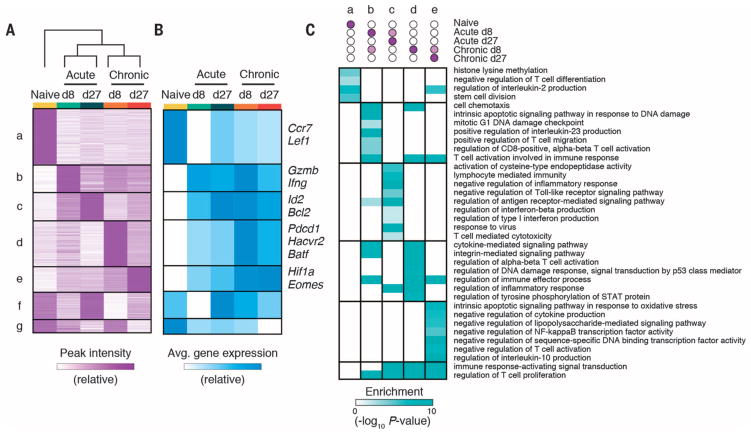
Fig. 2. State-specific enhancers in CD8+ T cells form modules that map to functionally distinct classes of genes.
(A) Heat map of peak intensity for all differentially accessible regions (rows) clustered by similarity across cell states (columns). Shown are normalized numbers of cut sites (supplementary methods), scaled linearly from row minimum (white) to maximum (purple). (B) Heat map showing row-normalized average mRNA expression of neighboring genes within each module in (A) in each cell state. Informative genes from each module are shown on right. (C) Heat map showing enrichment of Gene Ontology (GO) terms (rows) in each module (columns). P-values (hypergeometric test) presented as −log10.

