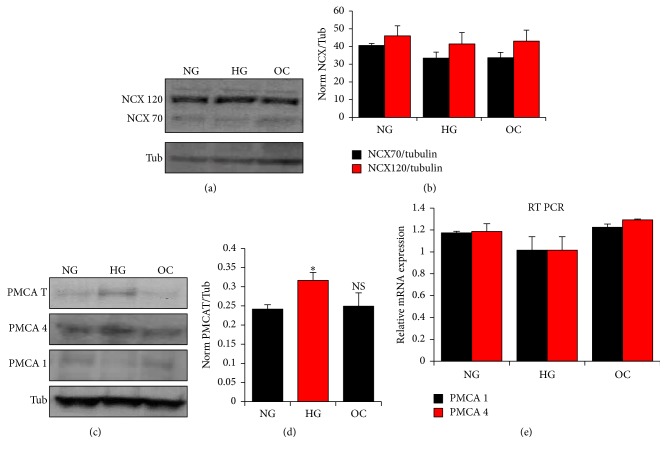
Figure 6.
Effect of glucose on PMCA and NCX expression in A7r5 VSM cells. The protein expression of PMCA (total, isoform 1, and isoform 4) and NCX (full length: NCX 120 and proteolytic fragment: NCX 70) were compared in A7r5 cells cultured under HG, NG and OC by western blot analysis (a, c). Densitometry analysis was performed using Gene Tools, Geliance 600 Imaging system (b, d). Gene expression of PMCA 1 and 4 was monitored by quantitative RT-PCR (e). Data are presented as mean ± SE from at least three independent experiments done each in triplicate. ∗p < 0.05; NS: not significant.

