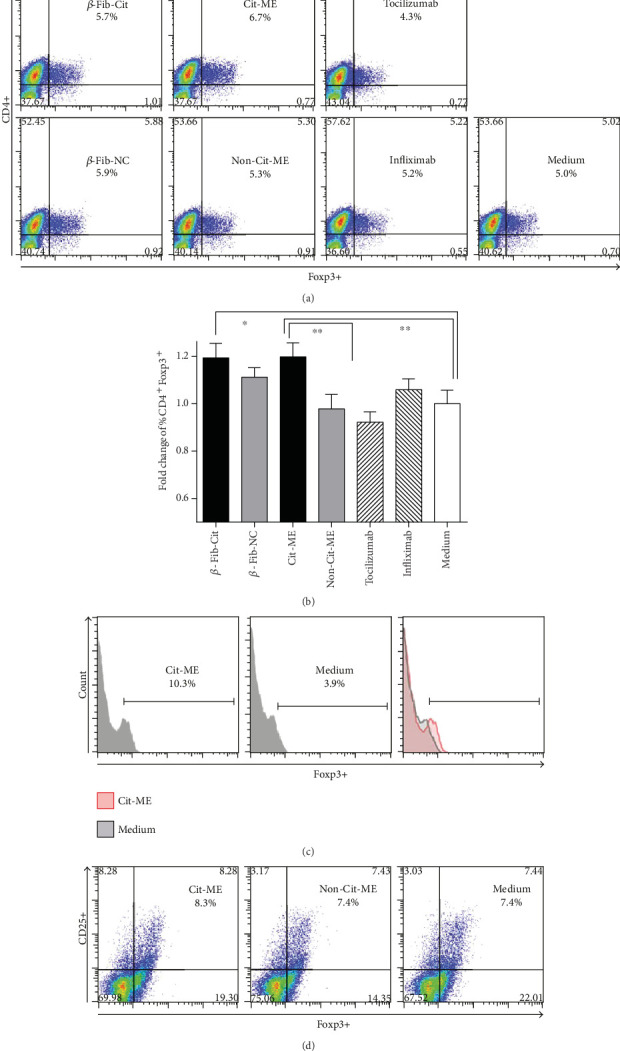
Figure 4.

Cit-ME upregulates Treg in vitro. (a) Representative dot plot of CD4+Foxp3+ T cells from a RA patient. Positive staining is presented in the right upper quadrant of each graph with the percentage indicated. (b) The fold change of % CD4+Foxp3+ T cells determined by flow cytometry (n = 6–13). Data are presented as mean values (∗p = 0.04, ∗∗p = 0.02). (c) Histogram shows representative Foxp3 staining for one RA patient, gated for CD4+ T cells. (d) Representative dot plot of RA patient PBMC gated for CD4 and analyzed for CD25 and Foxp3 expression.
