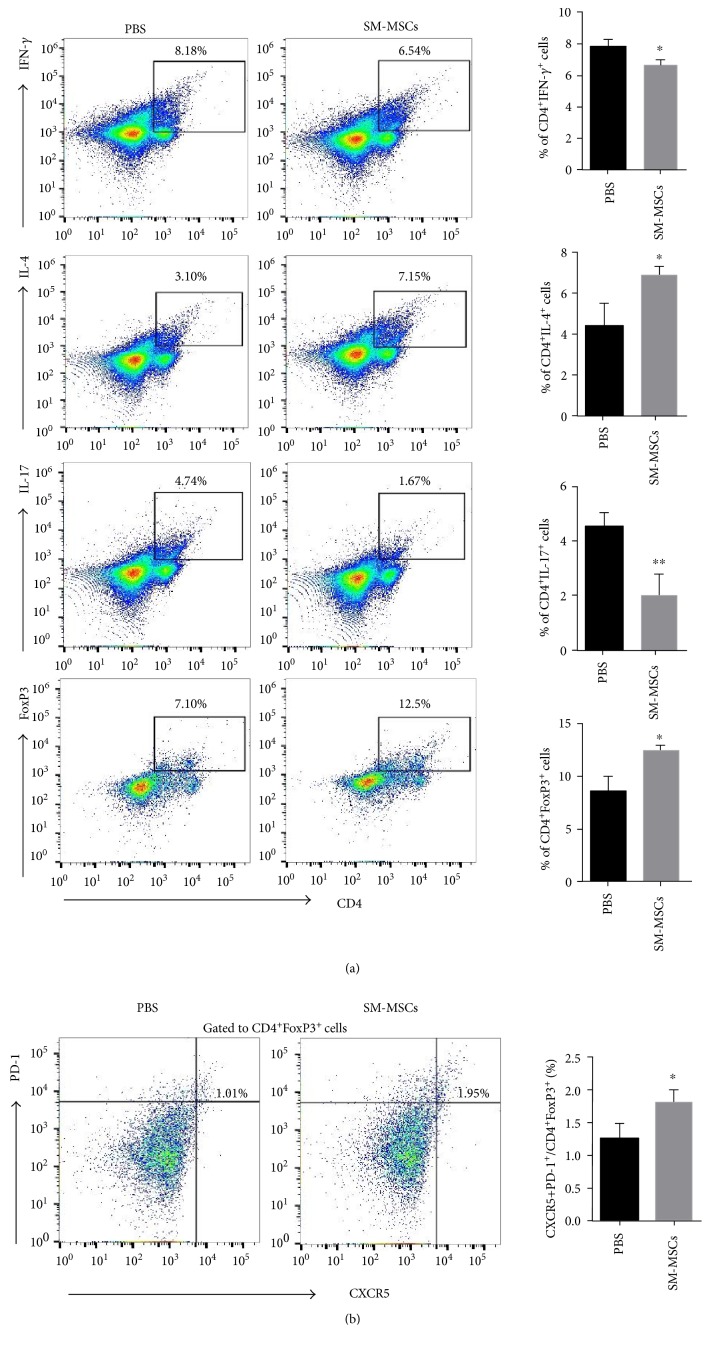
Figure 4.
Effect of SM-MSC treatment on the frequency of Th cell subsets in mice with CIA. Splenocytes from the mice in each group (n = 5 per group) were prepared and stimulated with PMA/ionomycin for 4 h, following which they were analyzed by flow cytometry. (a) Left, frequencies of Th1 (CD4+IFN-γ+), Th2 (CD4+IL-4+), Th17 (CD4+IL-17+), and Treg (CD4+FoxP3+) cells in the spleens of mice treated or not treated with SM-MSCs. Right, corresponding bar graphs show quantification of cell percentages. (b) Left, Tfr cells were assessed for the expression of PD-1+CXCR5+ cells gated from CD4+FoxP3+ cells by flow cytometry. Right, quantification of the percentage of CD4+CXCR5+PD-1+FoxP3+ cells. Data have been presented as mean±SD values. ∗p < 0.05, ∗∗p < 0.01.

