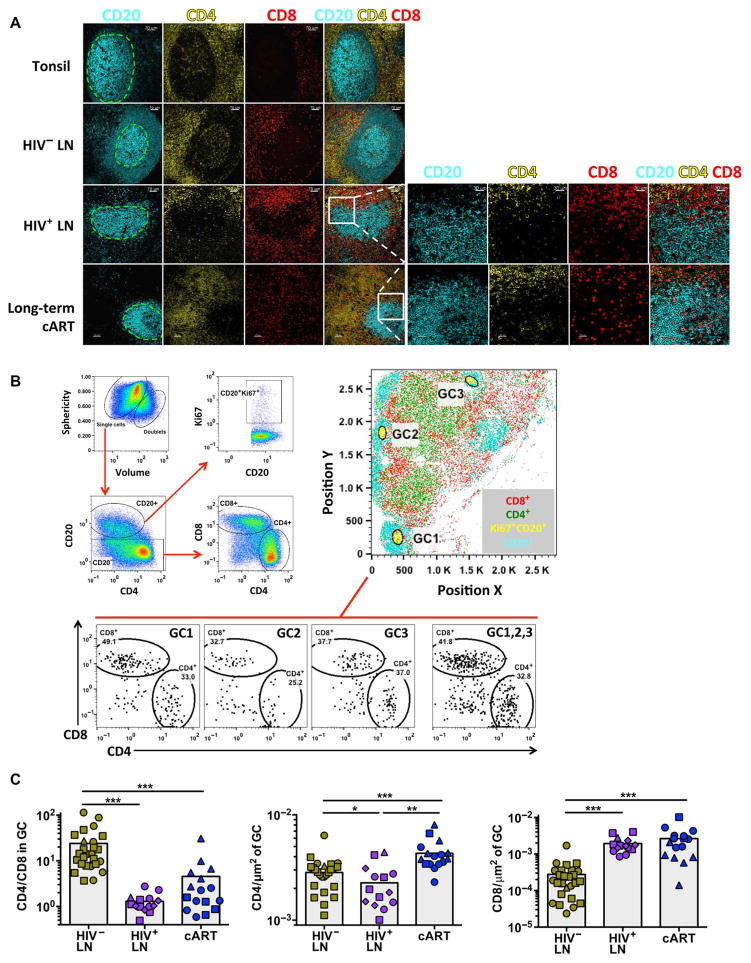
Fig. 2. fCD8 T cells accumulate in HIV-infected LNs.
(A) Confocal images showing the distribution of CD20, CD4, and CD8 T cells in representative tonsil and HIV− and HIV+ LNs (more than four samples were analyzed per group) and cART HIV+ LNs (three donors were analyzed). The green dashed lines indicate the GCs. Zoomed images of the highlighted area (white square) from a representative HIV+ LN, with or without treatment, show the presence of CD8 T cells within the GC (right panel). (B) Representative example of histo-cytometric analysis of an HIV+ LN (HIV+ #19). The gating scheme for the detection of particular populations is shown (left panel). The whole imaged area (position X, Y plot) and the position of three particular GCs (defined as CD20hiKi67hi) are shown (right panel). The relative frequency of CD4 and CD8 T cells within the individual and combined (GC1, 2, 3) GCs is shown (lower panel). (C) Pooled data of the CD4 and CD8 T cell frequencies within the GCs from HIV− (n = 3), viremic HIV+ (n = 4), and cART-treated HIV+ (n = 3) LNs. Different symbols (circle, square, triangle, or diamond) represent different donors, whereas each dot represents a different GC. Results show the CD4/CD8 T cell ratio within GCs (left panel) and the CD4 (middle panel) and CD8 (right panel) T cell frequencies normalized by the GC area. The Mann-Whitney U test was used for analysis; *P < 0.05, **P < 0.001, ***P < 0.0001.

