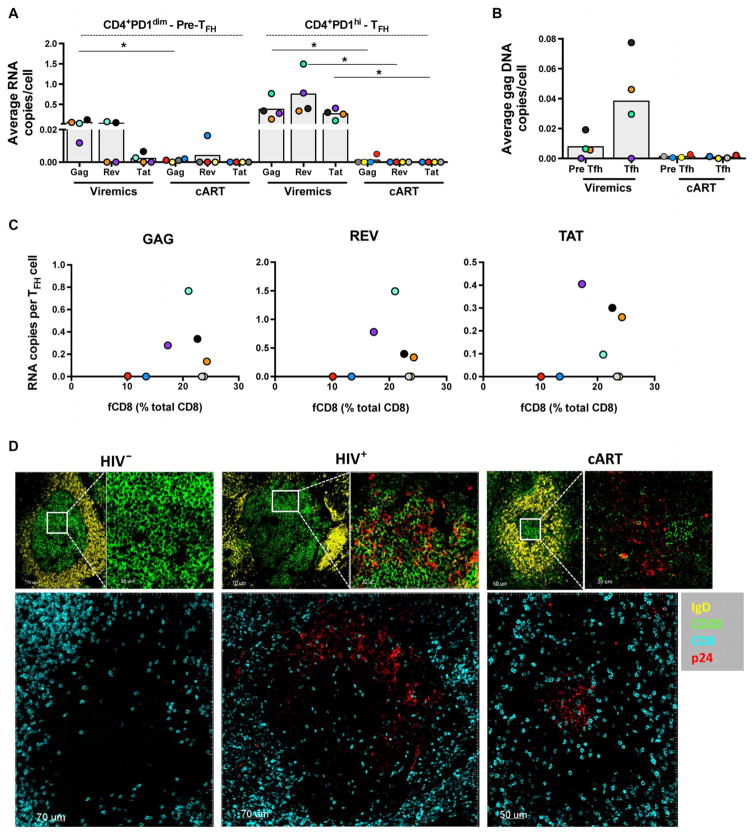
Fig. 3. No direct association between viral antigens and fCD8.
(A) Average copy number per cell of gag, rev, and tat RNA in sorted CD4+PD-1dim pre-TFH and CD4+PD-1high TFH cells from viremic (n = 4) and long-term cART-treated donors (n = 4). Each color represents a different donor. Mann-Whitney U test, *P < 0.05. (B) HIV gag DNA copies in sorted TFH CD4 T cells from viremic (n = 4) and long-term cART (n = 4) LNs and the frequency of the corresponding fCD8 are shown. (C) Relationship between the frequency of fCD8 and the average copy number per TFH cell of gag, rev, and tat RNA. (D) Representative confocal images (20×) showing the p24 antigen distribution in follicles from HIV−, HIV+, and long-term cART LNs. Follicular areas were defined by IgD and CD20 expression. Zoomed areas showing the distribution of p24+ cells within the GCs (IgDloCD20hi) are also shown. The distribution of CD8 T cells and p24+ cells in the follicles is shown in the lower panels.

