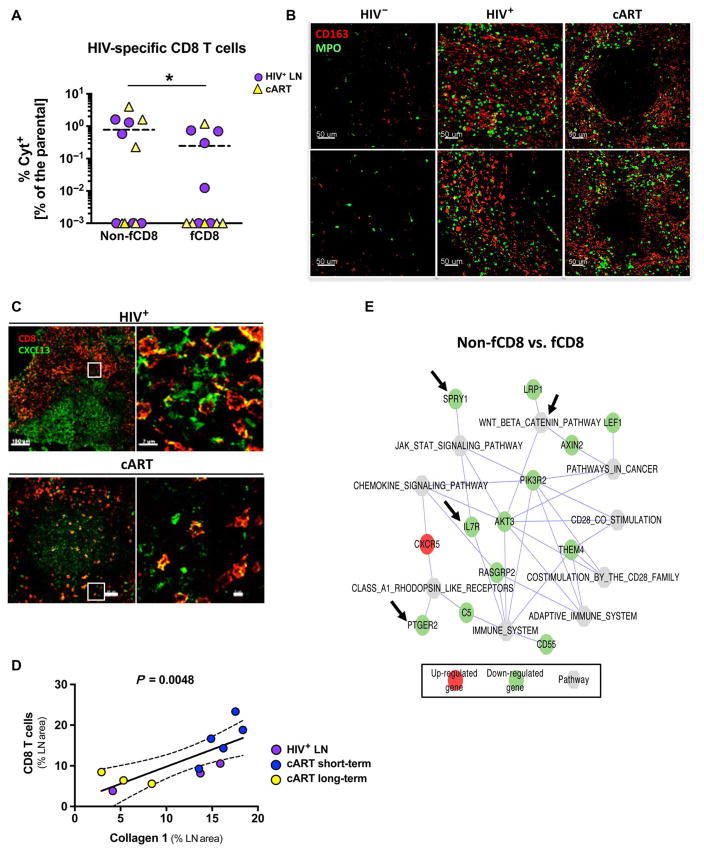
Fig. 4. Local immune activation is a driving force for fCD8 T cell dynamics.
(A) Frequency of gag-specific non-fCD8 and fCD8 T cells producing cytokines [interferon-γ (IFN-γ) and/or tumor necrosis factor–α (TNF-α) and/or macrophage inflammatory protein 1β (MIP-1β)] from HIV+ (n = 6) and long-term cART (n = 6) LNs. (B) Representative confocal images (20×) showing CD163+ monocyte infiltration and tissue activation [myeloperoxidase (MPO)] in HIV−, HIV+, and long-term cART LNs. Two representative B cell follicle areas from each tissue are shown. (C) Representative confocal images (40×) showing CD8 and CXCL13 distribution in HIV-infected LN with or without treatment. A follicular area and a zoomed area within each B cell follicle (white squares) are shown. (D) Correlation between the frequency (expressed as the LN area covered by CD8) of CD8 T cells within the LN and the amount of fibrosis (expressed as the LN area covered by collagen 1) in LNs from HIV-infected donors (three viremic, five short-term cART, and three long-term cART). (E) Network pathways and related genes analysis between non-fCD8 and fCD8 T cells generated by cytoscape software. Gene transcripts highlighted in red occurred at higher levels in fCD8 cells, and those in green occurred at higher levels in non-fCD8 cells. Specific genes or pathways mentioned in Results are highlighted with arrows.

