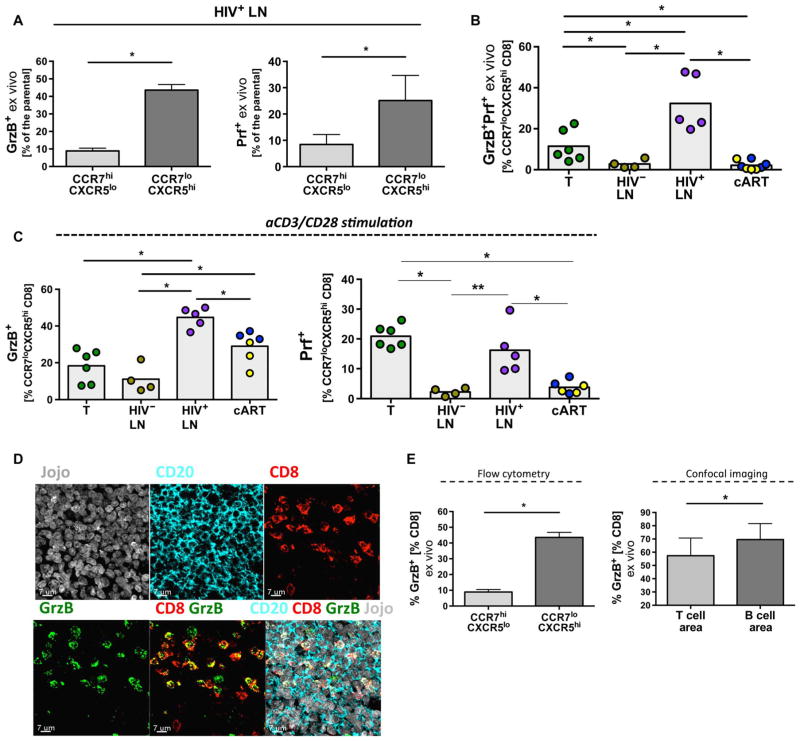
Fig. 6. fCD8 T cells exhibit potent cytolytic ability.
(A) Frequency of CCR7hiCXCR5lo and CCR7loCXCR5hi CD8 T cells from HIV+ LNs (n = 5) expressing ex vivo GrzB or Prf. Mann-Whitney U test; *P < 0.05. (B) Frequency of fCD8 T cells co-expressing GrzB and Prf ex vivo. Results are shown as frequency of the parental fCD8 (CCR7loCXCR5hi) population, Mann-Whitney U test (shown; *P < 0.05), ANOVA (P = 0.0017) (blue dots, short-term cART; yellow dots, long-term cART). (C) Frequency of fCD8 T cells expressing GrzB or de novo synthesized Prf among the different tissues after short stimulation with aCD3/CD28. Results are shown as frequency of fCD8 T cells. Mann-Whitney U test (shown; *P < 0.05), ANOVA (P = 0.0018 and P = 0.0012 for GrzB and Prf, respectively). (D) Representative confocal images (63×) showing fCD8 T cells from a viremic HIV+ LN (GC area) expressing GrzB. Individual staining as well as merged (CD8/GrzB and CD20/CD8/GrzB/Jojo) images are shown. (E) The ratio of GrzB+CD8/CD8 in GCs and nonfollicular areas calculated by flow cytometry or imaging analysis from viremic LNs (n = 3) is shown, Mann-Whitney U test; *P < 0.05.

