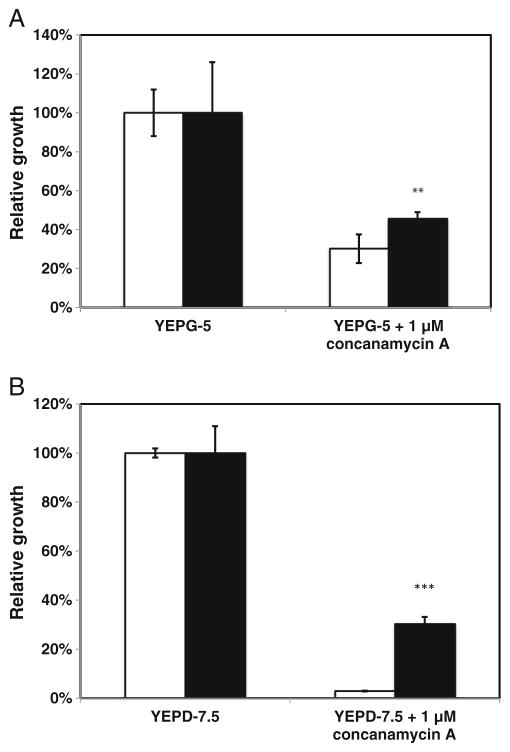
Fig. 6.
Effect of PEP3 overexpression on V-ATPase activity. a S288c leu2Δ/pGP564-PEP3 (black bar) exhibited better relative growth in the presence of the V-ATPase inhibitor concanamycin A than S288c leu2Δ/pGP564 (white bar) in YEPG-5 and in b YEPD-7.5. Data are means± standard deviations (n=3). Asterisks indicate a significant difference between the strains, **p<0.01, ***p<0.001. The relative growth assay is defined in “Materials and methods” (indirect measurement of V-ATPase activity)

