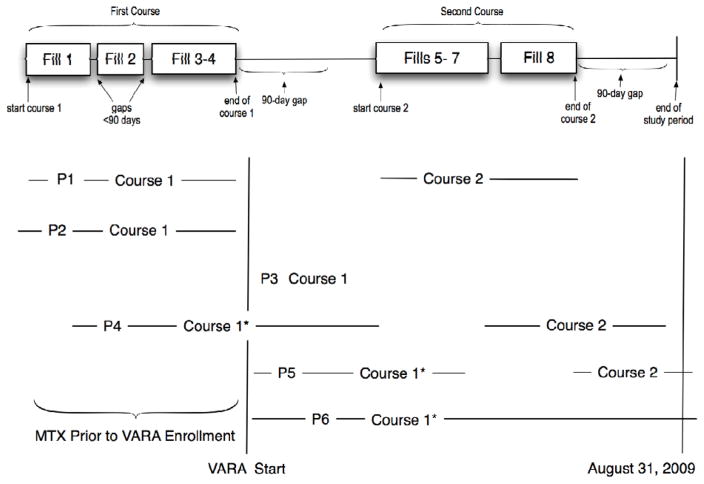
Appendix Figure. Illustration of Drug Course and Study Inclusion Criteria.
This figure demonstrates the experience with six different patients. Patient 1 (P1). The exposure experience at the top of the figure represents a magnified dispensing history for Patient 1 (P1) who had two courses of MTX therapy. The subject had four medication dispensings (fills) during the first course of therapy. The first two boxes, fill 1–2, represents a dispense date and the expected duration for that dispensing. The gaps between fills 1 & 2 indicate a brief duration where the subject was not expected to have access to the medication if the medication was used as prescribed. The third box includes two dispensings since no gap occurred in the patients expected drug supply, i.e., they refilled the medication early or on the day the estimated days supply ended. After the first four fills there is a period (gap) of greater than 90 days. Thus, the second course begins with fill #5 and continues through the expected end date for fill #8 which was also followed by a great than 90 day gap. Our analysis was limited to the first course of MTX. Because the first course of MTX for P1 ended before VARA enrollment, the patient is excluded from the analysis.
Other examples. Patient 2 (P2) represents a patient with a single course of MTX that ended before VARA enrollment and therefore was not included in the study. Patient 3 (P3) represents a patient with an initial course of MTX therapy that did not reach the 90-day in duration and/or did not have a DAS28 measurement after the impact date. This P3 course would not be included in the analysis. The initial course of therapy for patient 4 (P4), patient 5 (P5), and patient 6 (P6) would be selected because these patient had a course of at least 90 days duration and had at least one DAS28 recorded in the VARA database during the initial MTX course and after 90 days of treatment. P4 would be included in the established user group. P5 and P6 would in the incident user group. Only the first course would be included for P5.

