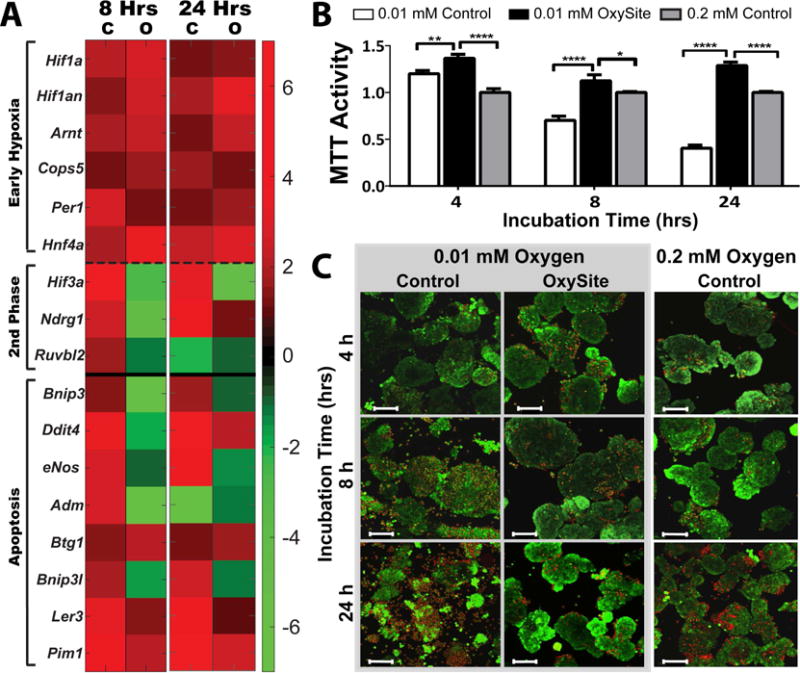
Figure 4. OxySite mitigates activation of second stage hypoxic and apoptotic markers, leading to preservation of metabolic activity and viability.

A) Heatmap summary of differential gene expression of early (above dashed line) and second stage (below dashed line) stage hypoxic and apoptotic (below solid line) markers from islets following low oxygen (0.01 mM) culture without (C) or with OxySite (O) after 8 and 24 h. Results are expressed as fold regulation over standard oxygen (0.2 mM) controls, with increased (red) or decreased (green) fold expression scaled according to scale bar shown. B) Metabolic activity (measured via MTT) for islets following 4, 8, and 24 h culture under low oxygen (0.01 mM) without (white bars) or with OxySite (black bars), compared to standard oxygen (0.02 mM) controls (grey bars). * p < 0.05, ** p < 0.01, **** p< 0.0001. C) Visualization of islet viability via live/dead staining (green = live; red = dead) after 4, 8, and 24 hr culture under 0.01 mM oxygen without (Control; left panel) or with Oxysite (middle panel), compared to 0.2mM Oxygen control cultures (right panel). Scale bar = 100 μm.
