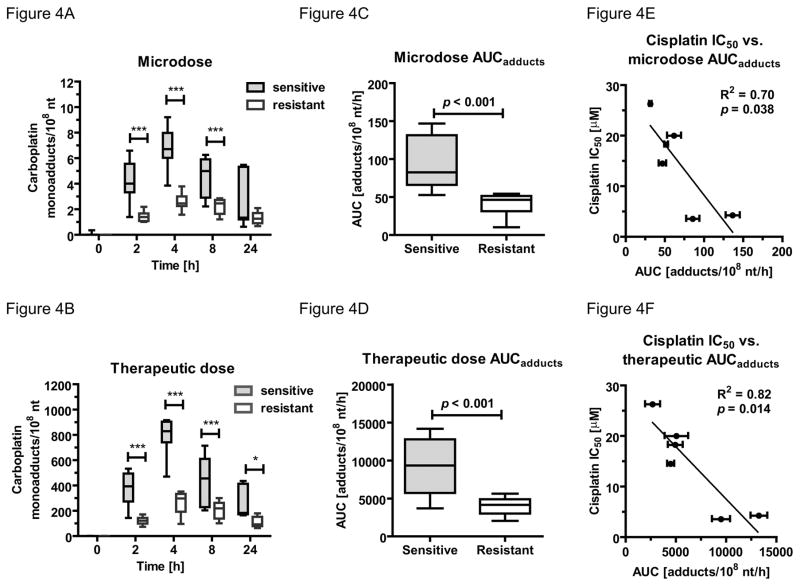
Figure 4. Correlation between NSCLC cell line sensitivity and carboplatin-DNA monoadduct levels.
Box plot (whiskers min to max) comparing monoadduct levels in carboplatin-sensitive (H23, H460, H727) and –resistant (HCC827, H1975, A549) NSCLC cell lines over 24 h. Three most resistant cell lines (white box) had significant (*** = p < 0.001, * = p < 0.05, one-way ANOVA with Bonferroni’s multiple comparison test) lower adduct level A. after microdose or B. therapeutic dose. Comparison of area under the adduct curve (AUCadduct) between sensitive (grey box) and resistant (white box) in NSCLC cell lines after 4h of treatment with C. 1 μM (microdose) or D. 100 μM (therapeutic dose) of carboplatin. The sensitive cell lines had significant higher AUCadduct (p < 0.001, student t-test) the resistant NSCLC cell lines. Linear correlation of AUCadduct E. microdose (R2 = 0.70, p = 0.038) or F. therapeutic dose (R2 = 0.82, p = 0.014) with cell sensitivity (IC50) towards cisplatin.

