
Fig. 5.
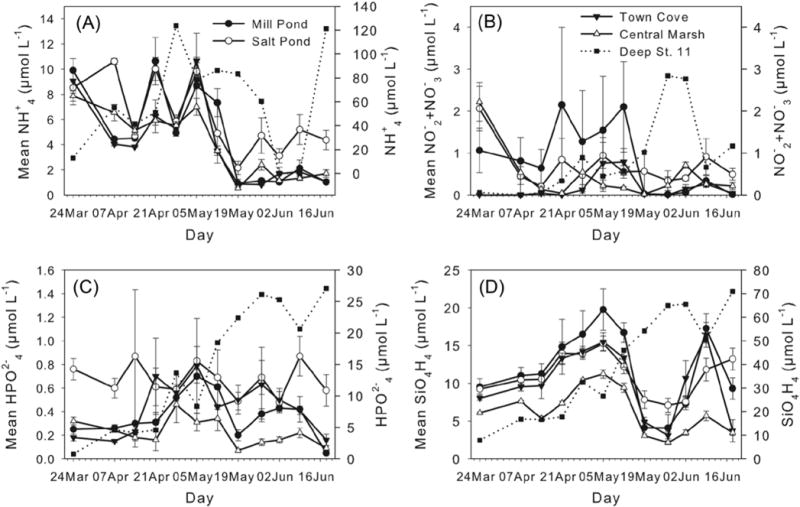
Temporal evolution of mean nutrient concentrations: (a) Mean NH+4 (μmol L−1), (b) mean NO−2 +NO−3 (μmol L−1), (c) mean HPO2−4 (μmol L−1) and (d) mean SiO4H4 (μmol L−1). Filled circle: Mill Pond; open circle: Salt Pond; filled inverted triangle: Town Cove; open triangle: central marsh. Filled squares and dashed line and right axis value indicate the bottom nutrient concentrations at the depth hole in Mill Pond (station 11). Error bars indicate standard error. X-axis labels indicate the sampling day.