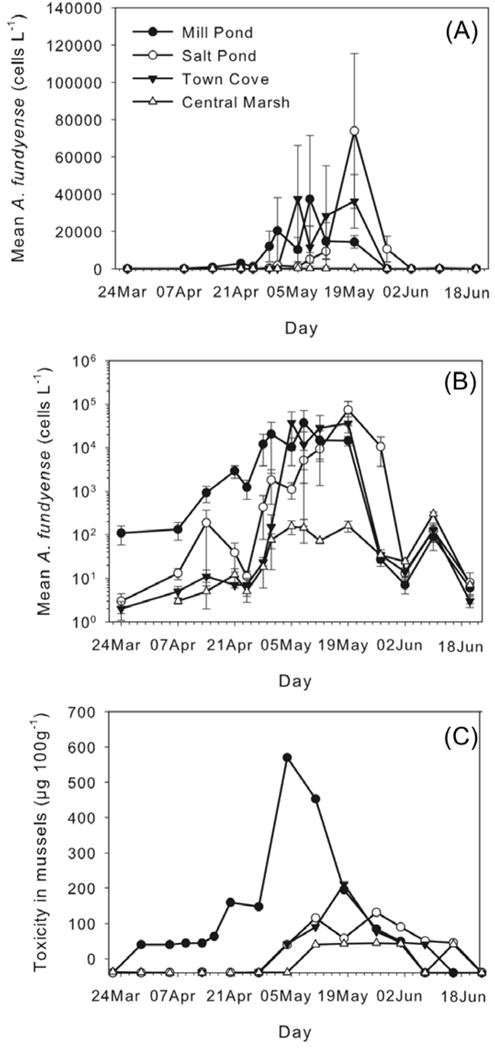
Fig. 6.

Temporal evolution of mean A. fundyense cell concentrations (cells L−1): (a) linear scale and (b) logarithmic scale. (c) Temporal evolution of toxicity in mussels (μg 100g−1), data recorded by MA- DMF. Filled circle: Mill Pond; open circle: Salt Pond; Filled inverted triangle: Town Cove; open triangle: central marsh. Error bars in (a) and (b) indicate standard error. X-axis labels indicate the sampling day.
