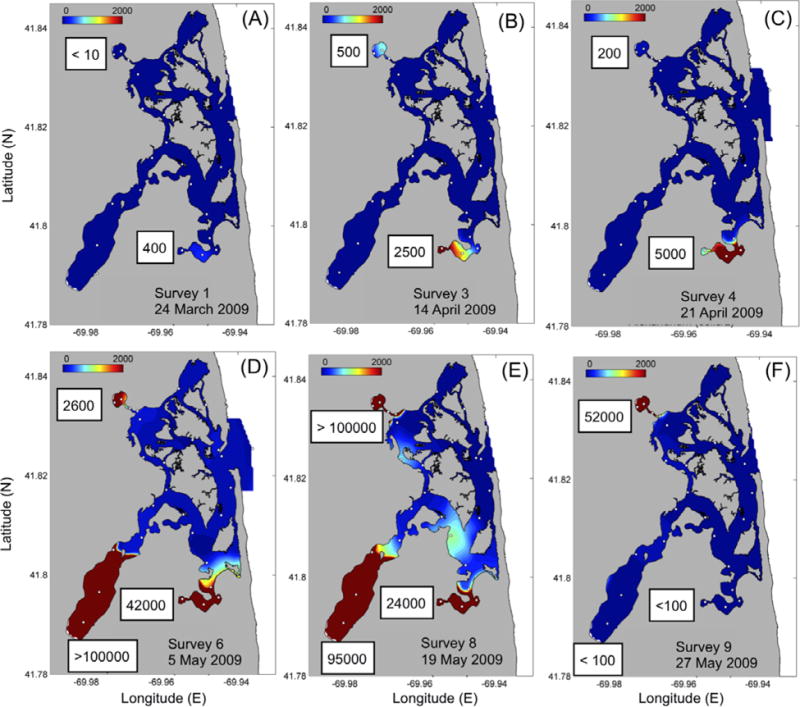
Fig. 7.

Distribution of A. fundyense cell concentrations (cells L−1) during (a) March 24, (b) April 14 (c) April 21, (d) May 5, (6) May 19 and (f) May 27. Maximum number of cells for Mill Pond, Town Cove and Salt Pond indicated in the white squares. White dots indicate sample sites.
