Fig. 9.

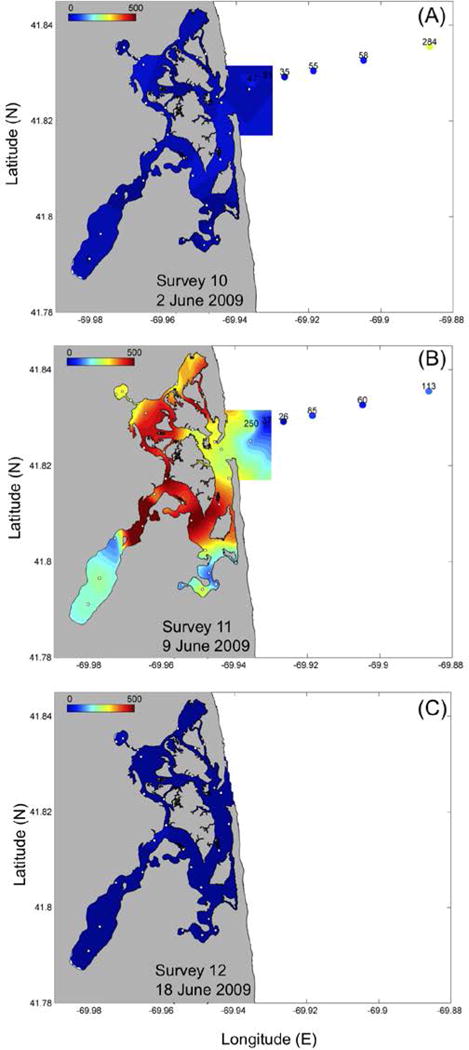
Distribution of A. fundyense cell concentrations (cells L−1) during (a) June 2, (b) June 9 and (c) June 18. Note the change of scale from 0–2000 in Fig.7 to 0–500 cells L−1. White dots indicate sample sites.

Distribution of A. fundyense cell concentrations (cells L−1) during (a) June 2, (b) June 9 and (c) June 18. Note the change of scale from 0–2000 in Fig.7 to 0–500 cells L−1. White dots indicate sample sites.