
Figure 2.
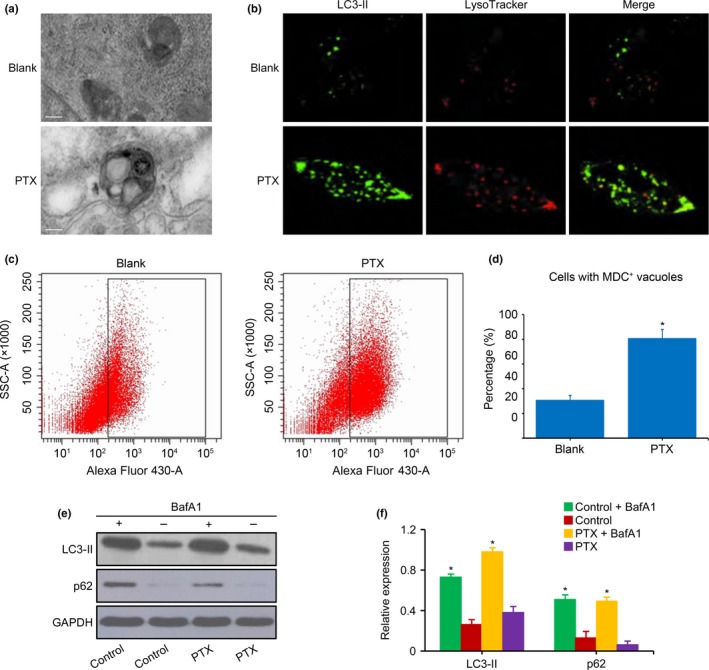
Vacuole and autophagic flux in neuroblastoma (NB) cells exposed to paclitaxel (PTX). (a) Representative ultrastructure of SK‐N‐SH cells was analyzed by transmission electron microscopy. Large vacuoles with a double‐membrane were observed in the cytoplasm of cells exposed to PTX (10 nM), whereas the membranes, organelles, and nuclei were normal in cells not exposed to PTX. (b) Cells with vacuoles detected by LysoTracker staining in QDDQ‐NM cells exposed to PTX (10 nM). (c,d) Quantification of the autophagosomes in SK‐N‐SH cells as determined by flow cytometry. The percentage of NB cells with MDC + vacuoles was higher after exposure to PTX (10 nM) than in NB cells that were not exposed to PTX. (e,f) LC3‐II and p62 in QDDQ‐NM cells measured by western blot. The increased levels of LC3‐II and p62 expression that resulted from BafA1 treatment were higher in NB cells exposed to PTX (10 nM) compared with cells that were not exposed to PTX. The data represent the mean ± SEM of three independent experiments. Scale bar is 2 μm. *P < 0.01, two‐tailed t‐test.