. 2015 May 19;6(7):4131–4140. doi: 10.1039/c5sc00880h

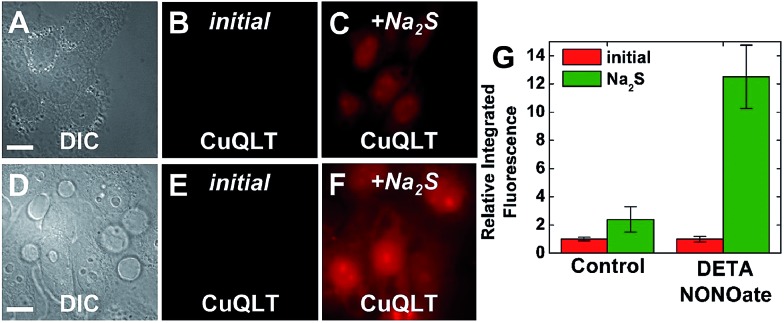
Fig. 12. Fluorescence microscopy images of live HeLa cells incubated with 4 μM CuQLT at 37 °C for 15 min in PBS. Top: control cells. (A) DIC image. CuQLT signal (B) before and (C) 15 min after treatment with 1.25 mM Na2S on the microscope stage. Bottom: cells pre-treated with 200 μM DETA NONOate for 20 h at 37 °C in DMEM. (D) DIC image. CuQLT signal (E) before and (F) 15 min after treatment with 1.25 mM Na2S on the microscope stage. Both sets of cells were pre-incubated with 1 mM NMM in PBS for 30 min at 37 °C. (G) Quantification of the intracellular fluorescence response of CuQLT (mean ± SD, N = 52 for control cells, N = 34 for DETA NONOate-treated cells). Scale bar = 15 μm. For full-field images and associated nuclear staining, see Fig. S36. .

Fig. 12