
Figure 4. Granzyme B+ and perforin+CD8+ TILs co-express with PD-1/TIM-3 and further increased during cetuximab monotherapy.
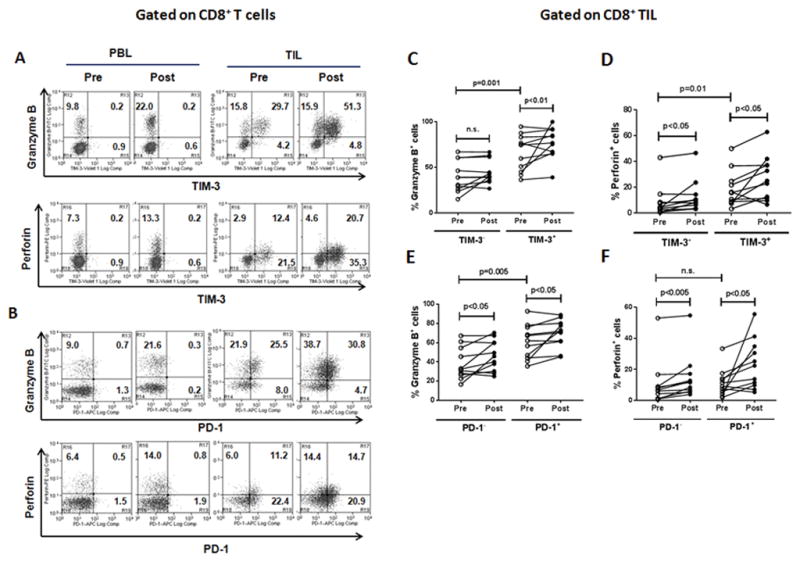
Representative flow cytometry analysis of co-expression of granzyme B/perforin and TIM-3 (A) or PD-1 (B) on CD8+ PBLs and TILs isolated from a HNSCC patient, Percentages of granzyme B+ (C and E) and perforin+ (D and F) in TIM-3− and TIM-3+ (C and D) or PD-1− and PD-1+ (E and F) CD8+ T-cell subsets were compared in 11 HNSCC patients at pre- and post-single agent cetuximab therapy.