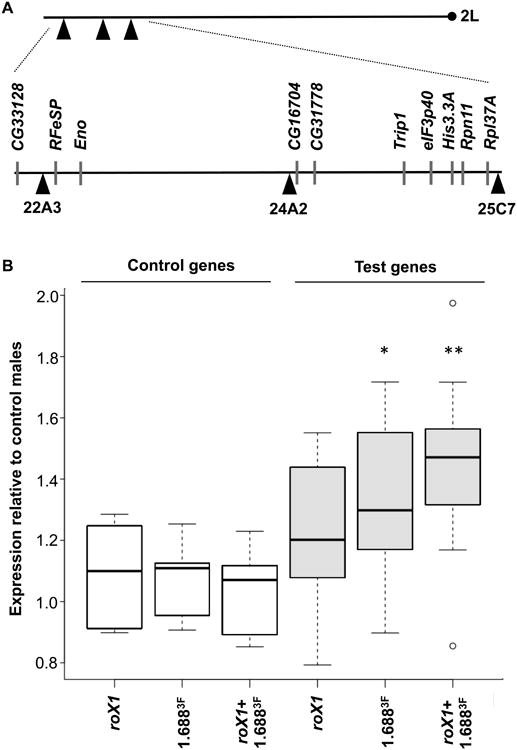
Fig. 2. Increased expression of autosomal genes near roX1 and 1.6883F transgenes.

A) Three transgene integration sites on distal 2L are depicted by black triangles. The centromere is shown by a black circle. Positions of test genes and integration sites are depicted below. B) Relative expression of control genes (located on 2R or 3) and test genes was measured by quantitative RT-PCR. The ratio of expression in larval males with the indicated transgenes to control males (no transgenes) is depicted for 5 control genes (white) and 10 test genes (gray). Control genes show no changes in expression, but test genes display significant increases when [1.6883F]22A3+24A2+25C7 or [roX1+1.6883F]22A3+24A2+25C7 transgenes are present. * p<0.05, ** p<0.01. See also Figure S1 and Table S1.
