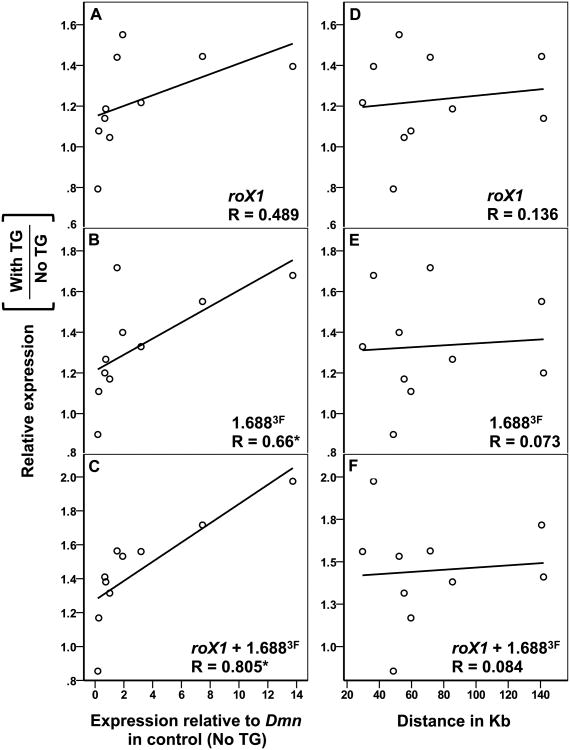
Fig. 3. Increased expression near roX1 and 1.6883F correlates with gene activity. A-C).
The fold change in expression of individual genes near 2L transgenes (Y-axis) is plotted against expression in control males (no transgenes; X-axis). Each gene was internally normalized to Dmn before calculating fold change. Dots represent the average of two biological replicates. A significant correlation is observed for [1.6883F]22A3+24A2+25C7 (B) and [roX1+1.6883F]22A3+24A2+25C7 (C) but not [roX1]22A3+24A2+25C7 (A). D-F) The fold change in expression of individual genes near 2L transgenes (Y-axis) is plotted against the distance between each gene and the nearest transgene (X-axis). No significant correlation was detected in these analyses. Pairwise correlation was performed using SPSS, the Pearson Correlation Coefficient (R) is shown (* p < 0.05). See also Figure S1 and Table S1.

