FIG. 2.

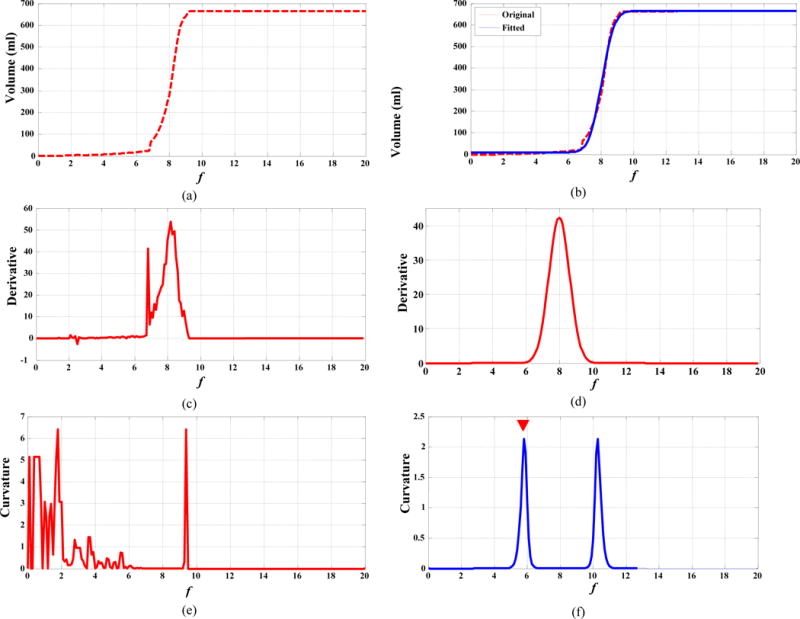
(a, c, e): f-volume curve for an esophageal tumor, its derivative, and its Menger curvature, respectively; (b, d, f): the fitted f-volume curve (blue line), its derivative, and its Menger curvature, respectively.

(a, c, e): f-volume curve for an esophageal tumor, its derivative, and its Menger curvature, respectively; (b, d, f): the fitted f-volume curve (blue line), its derivative, and its Menger curvature, respectively.