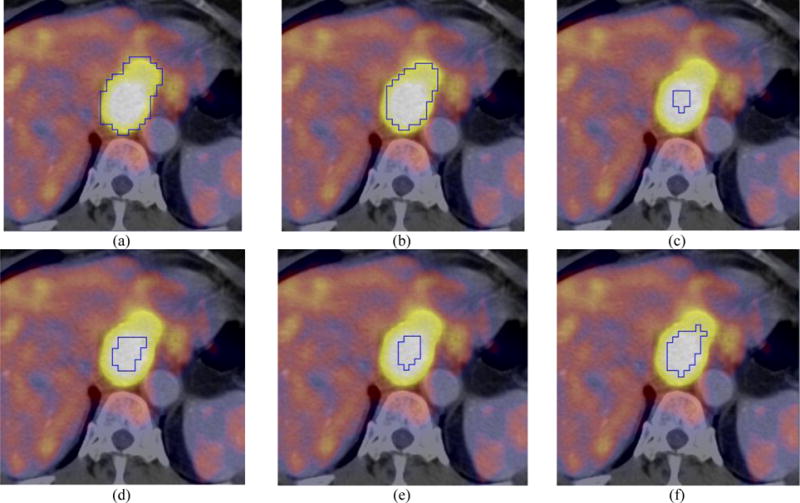
FIG. 6.

Visual comparison (axial PET/CT) for a patient with esophageal cancer: (a) manual contour; (b) ARG_MC (DSI=0.77); (c) CCRG_2.5 (DSI=0.30); (d) 42% Threshold (DSI=0.41); (e) Otsu (DSI=0.34); and (f) FCM (DSI=0.57). Closed blue contours represent the resulting tumor boundaries of different methods.
