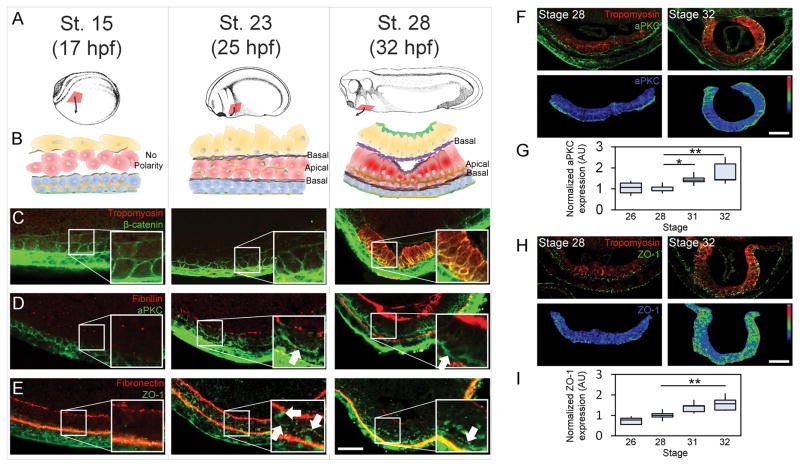
Figure 1. MET progression in Xenopus heart progenitor cells.
(A) Xenopus embryos at three stages during HPC (red) movement to ventral midline. (B) Transverse schematic of HPCs and their microenvironment (blue, ectoderm; red, mesoderm; yellow, endoderm, brown, fibronectin; purple, fibrillin; orange, aPKC; green, ZO-1; dark red, tropomyosin). (C) Cell shapes by β-catenin localization and cardiomyocyte by tropomyosin expression. (D) aPKC appears on the apical surface of HPCs (white arrow) with fibrillin at the HPC basal surface. (E) Tight junction protein ZO-1 appears perinuclearly and nascently on the apical surface by stage 23 and strongly at HPC apical intercellular junctions by stage 28. Fibronectin appears at all germ layer interfaces. (F–I) Apical aPKC (F–G) and ZO-1 (H–I) during early heart tube formation. Immunofluorescence show epithelial individual markers and tropomyosin (upper panels) and normalized intensity with pseudocolor LUT (lower panels). (G and H) quantify apical polarity from 5 to 6 embryos per time point over 2 clutches. All scale bars are 50 μm. * indicates p < 0.05, ** indicates p < 0.01. See also Figure S1.

