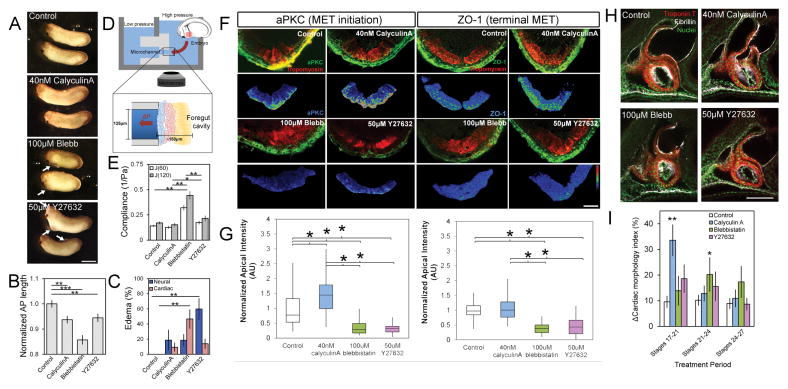
Figure 2. Modulating bulk tissue mechanics can accelerate or delay MET in heart progenitor cells.
(A) Modulators of tissue compliance applied during stages of early heart development exhibit defects, including pericardial and neural edemas (see arrows; scalebar, 1 mm), (B) altered AP length, and (C) increased rates of edema per clutch (N = 30–35 embryos over 4 clutches). (D) Compliance measured by microaspriation of HFR. (E) Compliance at stage 22 confirms blebbistatin and Y27632 increase and calyculin A decreases compliance (N = 11–17 embryos per treatment over 3 clutches). (F) Transverse sections through HFR at stage 28 show changes in polarity (aPKC or ZO-1) within progenitor population (red). Lower panels show the epithelial marker masked using tropomyosin expression (scale bar, 50 μm). (G) Apical intensity after small molecule inhibitor treatment (N = 9–13 embryos over 4 clutches). (H) Representative lateral confocal sections of stage 39 tadpole hearts (scale bar, 100 μm). (I) Cardiac anatomy after stage-specific inhibitor treatments as shown in Figure S2 (N = 5 embryos per treatment per period). Error bars represent mean ± SEM. * indicates p < 0.05; ** indicates p < 0.01. See also Figures S1, S2 and S3A.

